Fig. 5.
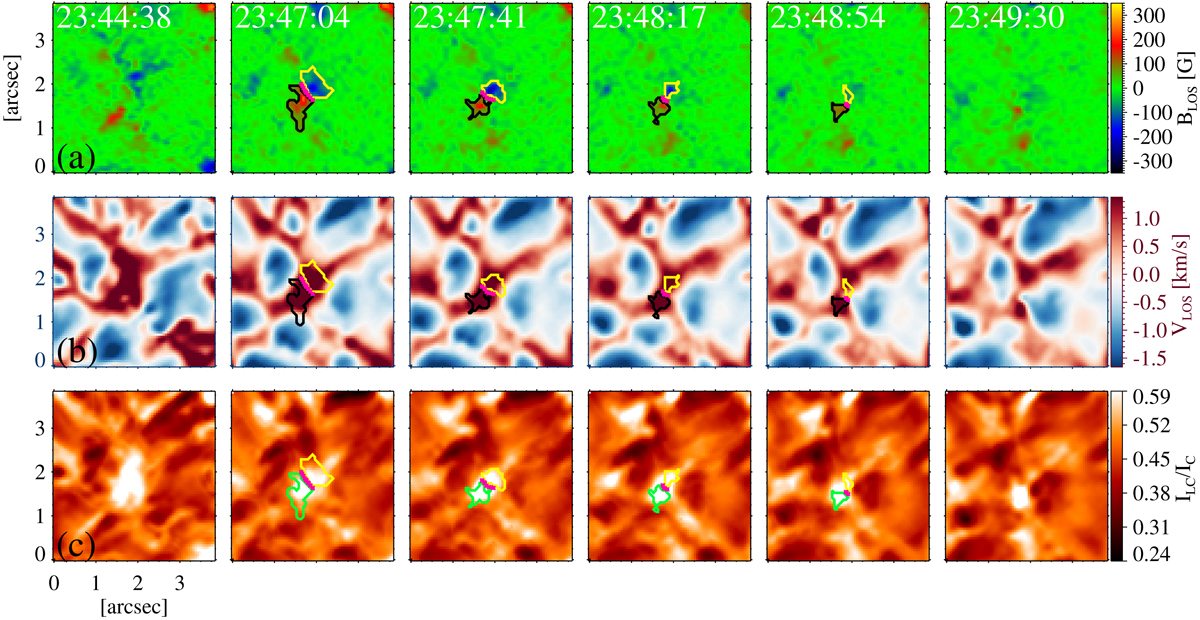
From top to bottom row: time series of line-of-sight component of magnetic field, BLOS (panel a) line-of-sight velocity, vLOS (panel b), and line core intensity normalized to the local continuum, for the canceling pair in ROI 9 (panel c). The magenta dots outline the PIL. The axes scales are the same as in Fig. 2 (a movie of the extended time series is available online).
Current usage metrics show cumulative count of Article Views (full-text article views including HTML views, PDF and ePub downloads, according to the available data) and Abstracts Views on Vision4Press platform.
Data correspond to usage on the plateform after 2015. The current usage metrics is available 48-96 hours after online publication and is updated daily on week days.
Initial download of the metrics may take a while.