Fig. 3.
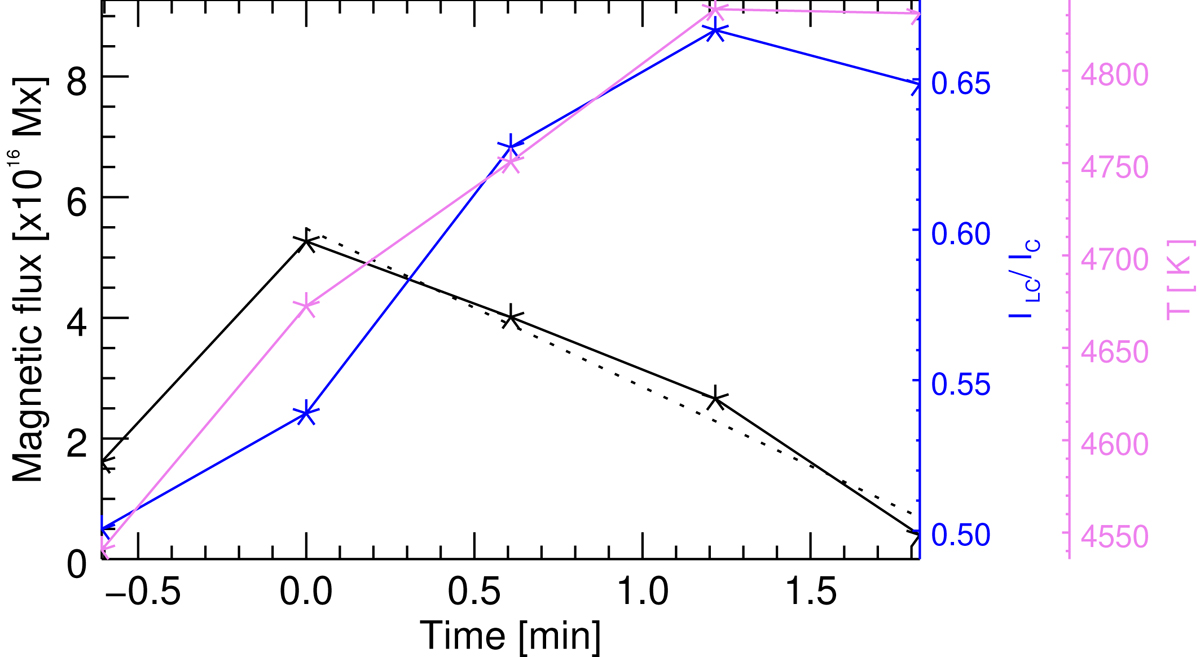
Evolution of key parameters of the canceling flux in ROI 7. Plotted are the variation with time of total magnetic flux of the positive polarity patch (black, referring to the scale on the left), line core intensity (blue, inner scale on the right) and temperature at log τ = −2.5 (magenta; outer scale on the right) averaged over the PIL. The line core intensity, ILC, is normalized to the local continuum intensity, IC. The dashed line is the linear fit to the decay phase of the flux evolution. Zero on the time axis represents the time at which the total magnetic flux of the smaller magnetic feature reaches its peak.
Current usage metrics show cumulative count of Article Views (full-text article views including HTML views, PDF and ePub downloads, according to the available data) and Abstracts Views on Vision4Press platform.
Data correspond to usage on the plateform after 2015. The current usage metrics is available 48-96 hours after online publication and is updated daily on week days.
Initial download of the metrics may take a while.