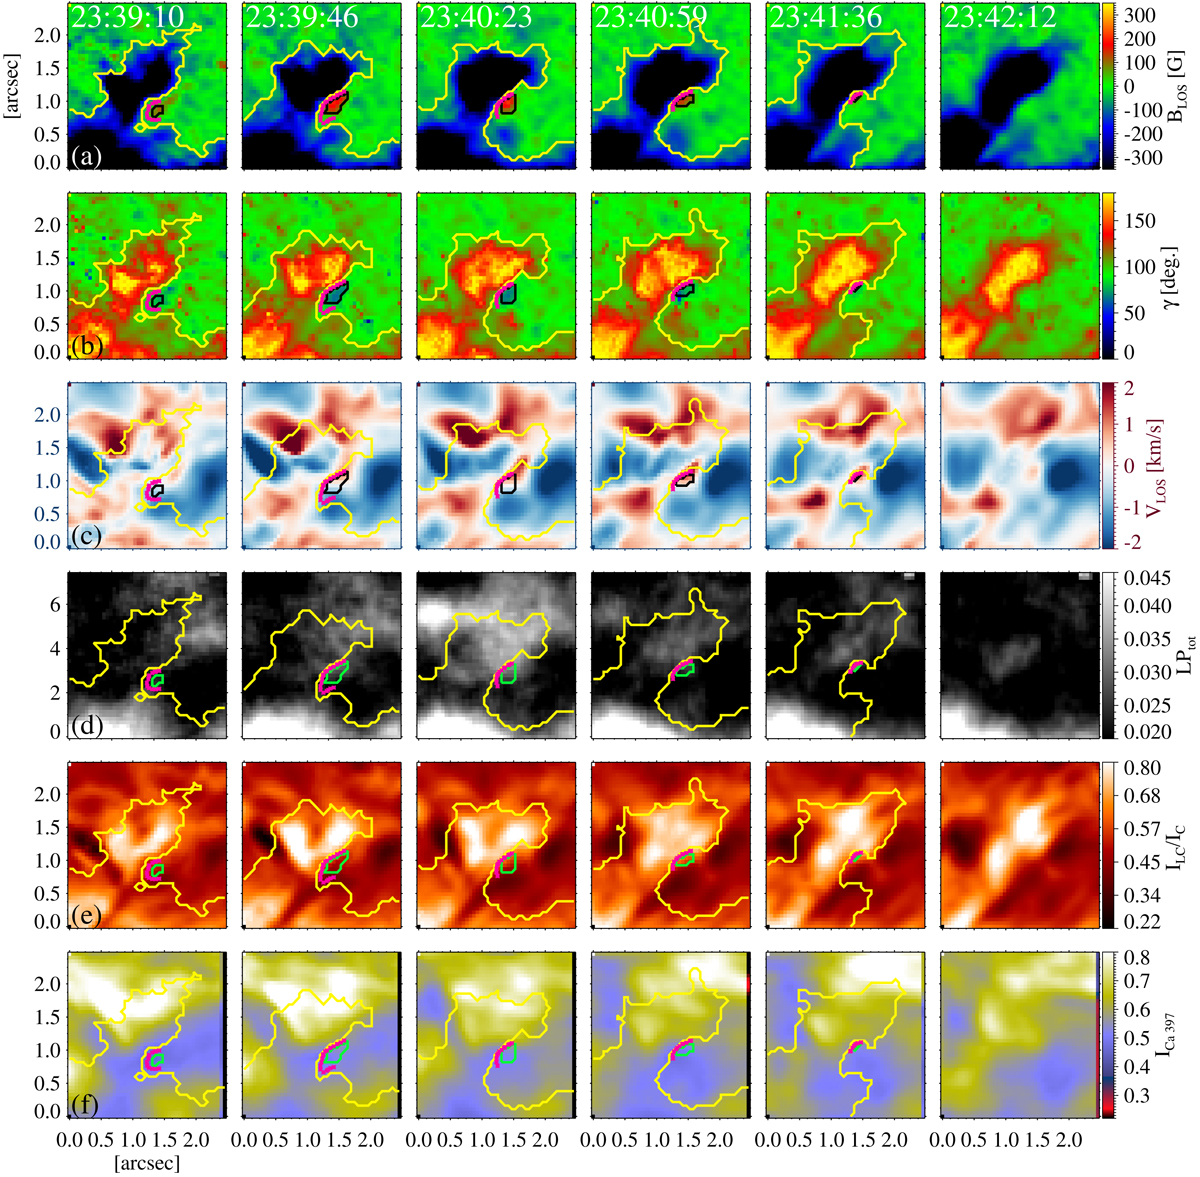
Fig. 2.

Evolution of the pair of magnetic elements in ROI 7. From top to bottom row: time series of line-of-sight component (LOS) of magnetic field, BLOS (panel a); field inclination relative to the LOS, γ (panel b); line-of-sight velocity, vLOS (panel c); total linear polarization (LPtot) (panel d); line core intensity ILC normalized to the local continuum IC (panel e), and Ca II H 397 nm intensity recorded by SuFI (panel f). The yellow contour encloses the large negative magnetic polarity patch and the black (panels a–c)/green (panels d–f) contour indicates the small positive polarity patch of the pair. The magenta dots outline the PIL between the two patches. Times at which the images were recorded are given in panel a.
Current usage metrics show cumulative count of Article Views (full-text article views including HTML views, PDF and ePub downloads, according to the available data) and Abstracts Views on Vision4Press platform.
Data correspond to usage on the plateform after 2015. The current usage metrics is available 48-96 hours after online publication and is updated daily on week days.
Initial download of the metrics may take a while.


