Fig. 6
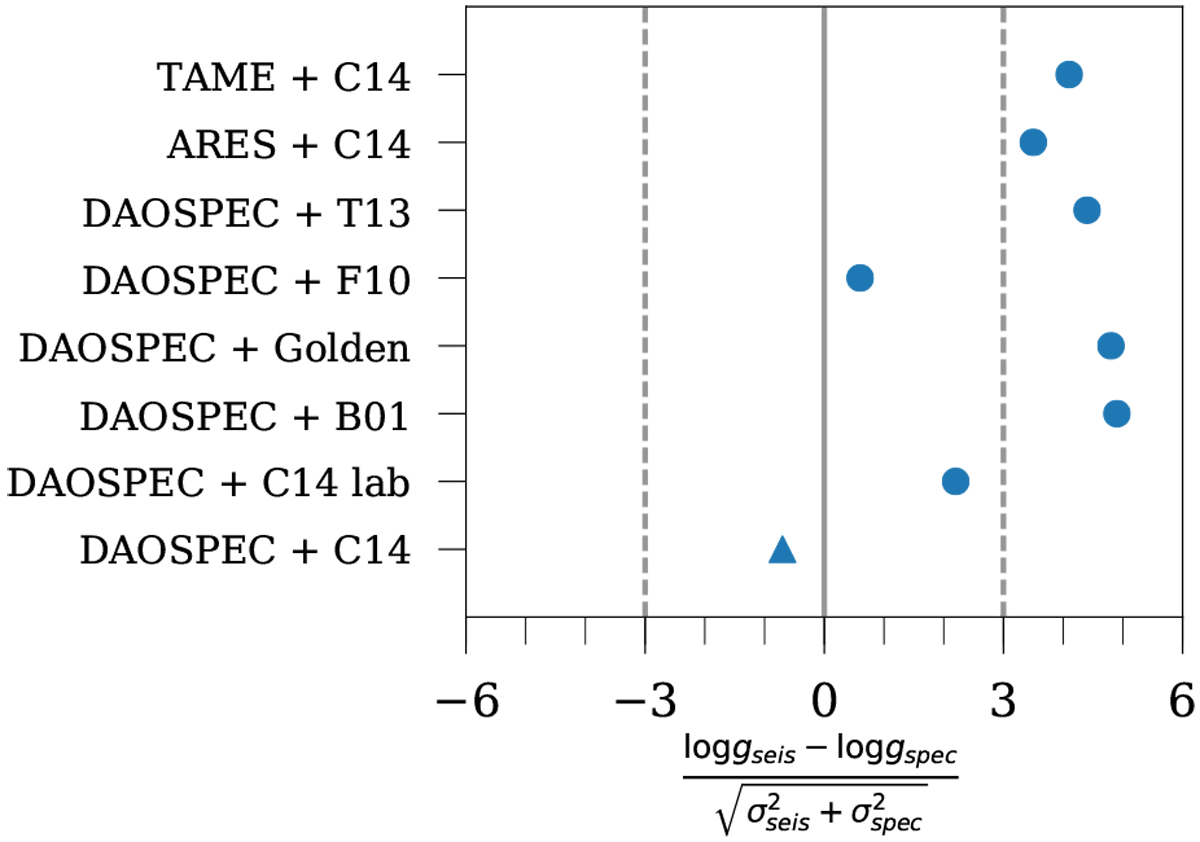
Deviation from the asteroseismic log g value for the M67 target for each method combination (middle panel in Fig 5). Full agreement with the asteroseismic log g is indicated with the vertical line and the two dashed lines show 3σ deviations. The final choice of line list and program is shown with a triangle in the bottom row.
Current usage metrics show cumulative count of Article Views (full-text article views including HTML views, PDF and ePub downloads, according to the available data) and Abstracts Views on Vision4Press platform.
Data correspond to usage on the plateform after 2015. The current usage metrics is available 48-96 hours after online publication and is updated daily on week days.
Initial download of the metrics may take a while.