Fig. 5
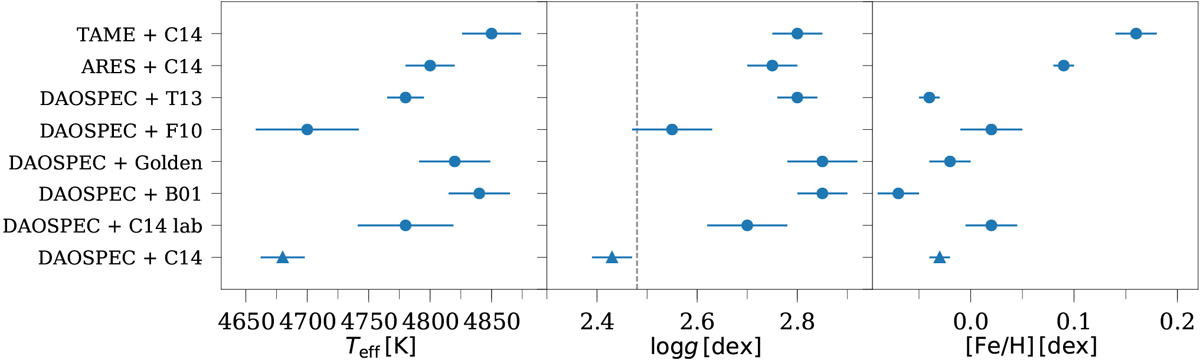
Comparison of atmospheric parameters for the M67 target with different combinations of line lists and program to measure equivalent widths. Left panel: Teff variations. Middle panel: log g variations. Right panel: [Fe/H] variations. The final choice of line list and program is shown with a triangle in the bottom row. The dashed line in the middle plot indicates the asteroseismic log g; see Fig. 6 for a comparison.
Current usage metrics show cumulative count of Article Views (full-text article views including HTML views, PDF and ePub downloads, according to the available data) and Abstracts Views on Vision4Press platform.
Data correspond to usage on the plateform after 2015. The current usage metrics is available 48-96 hours after online publication and is updated daily on week days.
Initial download of the metrics may take a while.