Fig. 9.
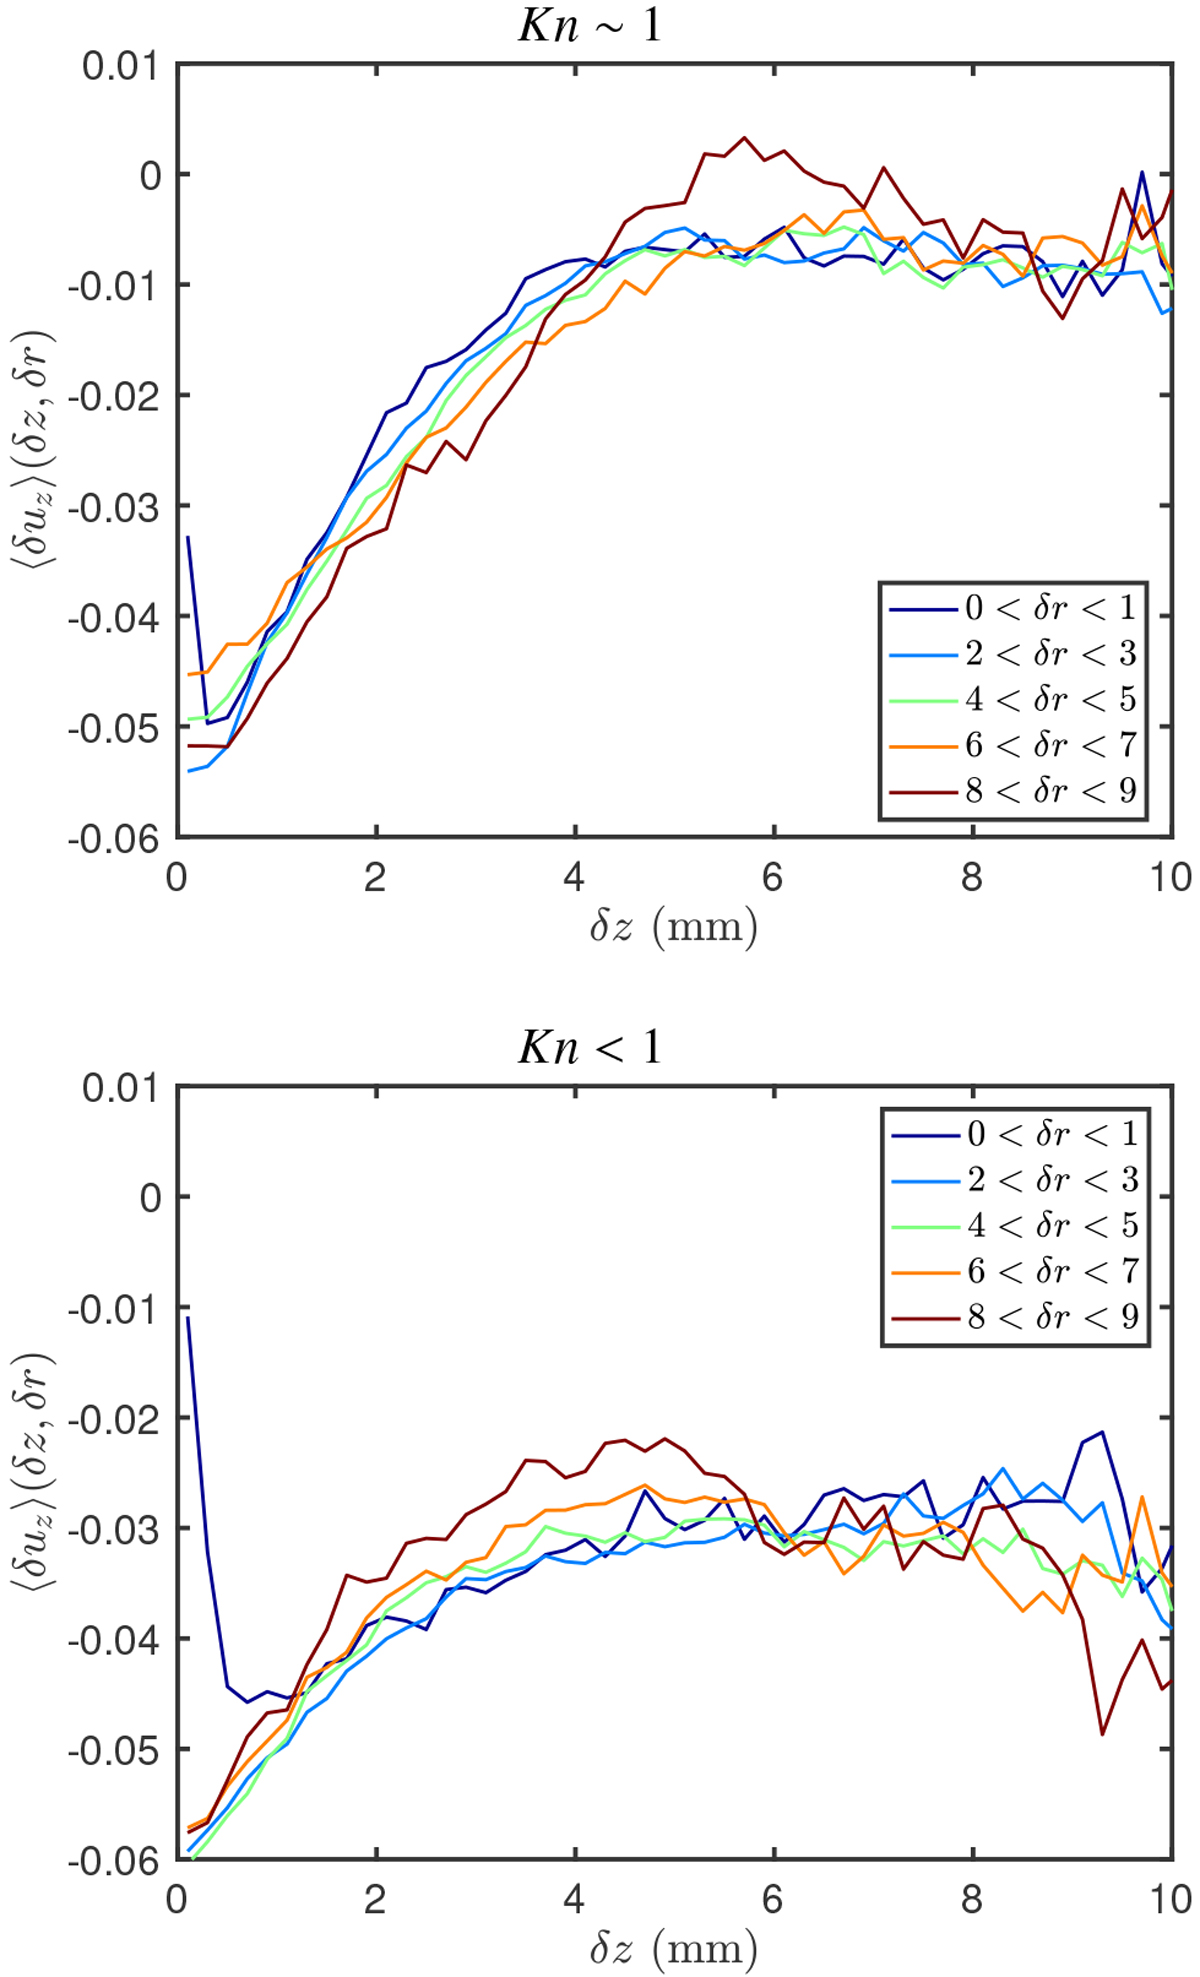
Mean vertical relative velocity between particle pairs in units of m s−1, as a functionof vertical separation. The Kn ~ 1 data is shown in the top panel and the Kn < 1 data in the bottom panel. The different curves refer to increasingly large values in δr. The aggregation dynamics is the same at all radial (horizontal) separations, suggesting the formation of a particle layer.
Current usage metrics show cumulative count of Article Views (full-text article views including HTML views, PDF and ePub downloads, according to the available data) and Abstracts Views on Vision4Press platform.
Data correspond to usage on the plateform after 2015. The current usage metrics is available 48-96 hours after online publication and is updated daily on week days.
Initial download of the metrics may take a while.