Fig. 5.
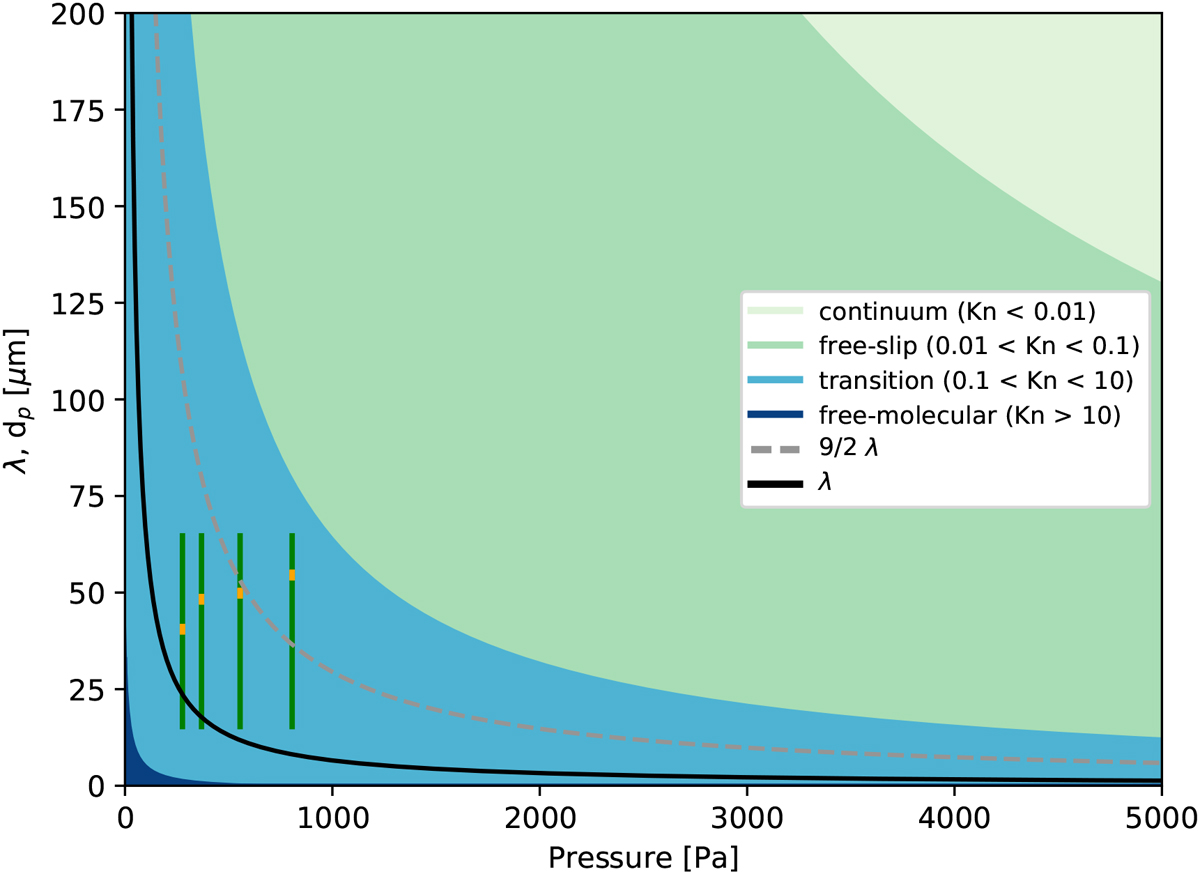
Flow conditions at the scale of particle size in the experiments. Black curve: the mean free path of gas molecules as a function of pressure λ(P). Coloured swaths denote Kn-dependent drag regimes. Grey dashed curve: Stokes–Epstein transition. The four vertical green bars represent each of the four data sets; the position of the bars denotes the pressure, their height denotes the spread in particle size for all experiments, and their width denotes the offset error in the pressure measurement. The orange subsegments indicate the particle sizes that have the steady-state velocity equaling the measured particle velocity in the experiment: up,ss = ⟨upz⟩. All the data sets can be considered transition flow, with the two at higher pressure further towards continuum and those at lower pressure approaching free molecular flow.
Current usage metrics show cumulative count of Article Views (full-text article views including HTML views, PDF and ePub downloads, according to the available data) and Abstracts Views on Vision4Press platform.
Data correspond to usage on the plateform after 2015. The current usage metrics is available 48-96 hours after online publication and is updated daily on week days.
Initial download of the metrics may take a while.