Fig. 3.
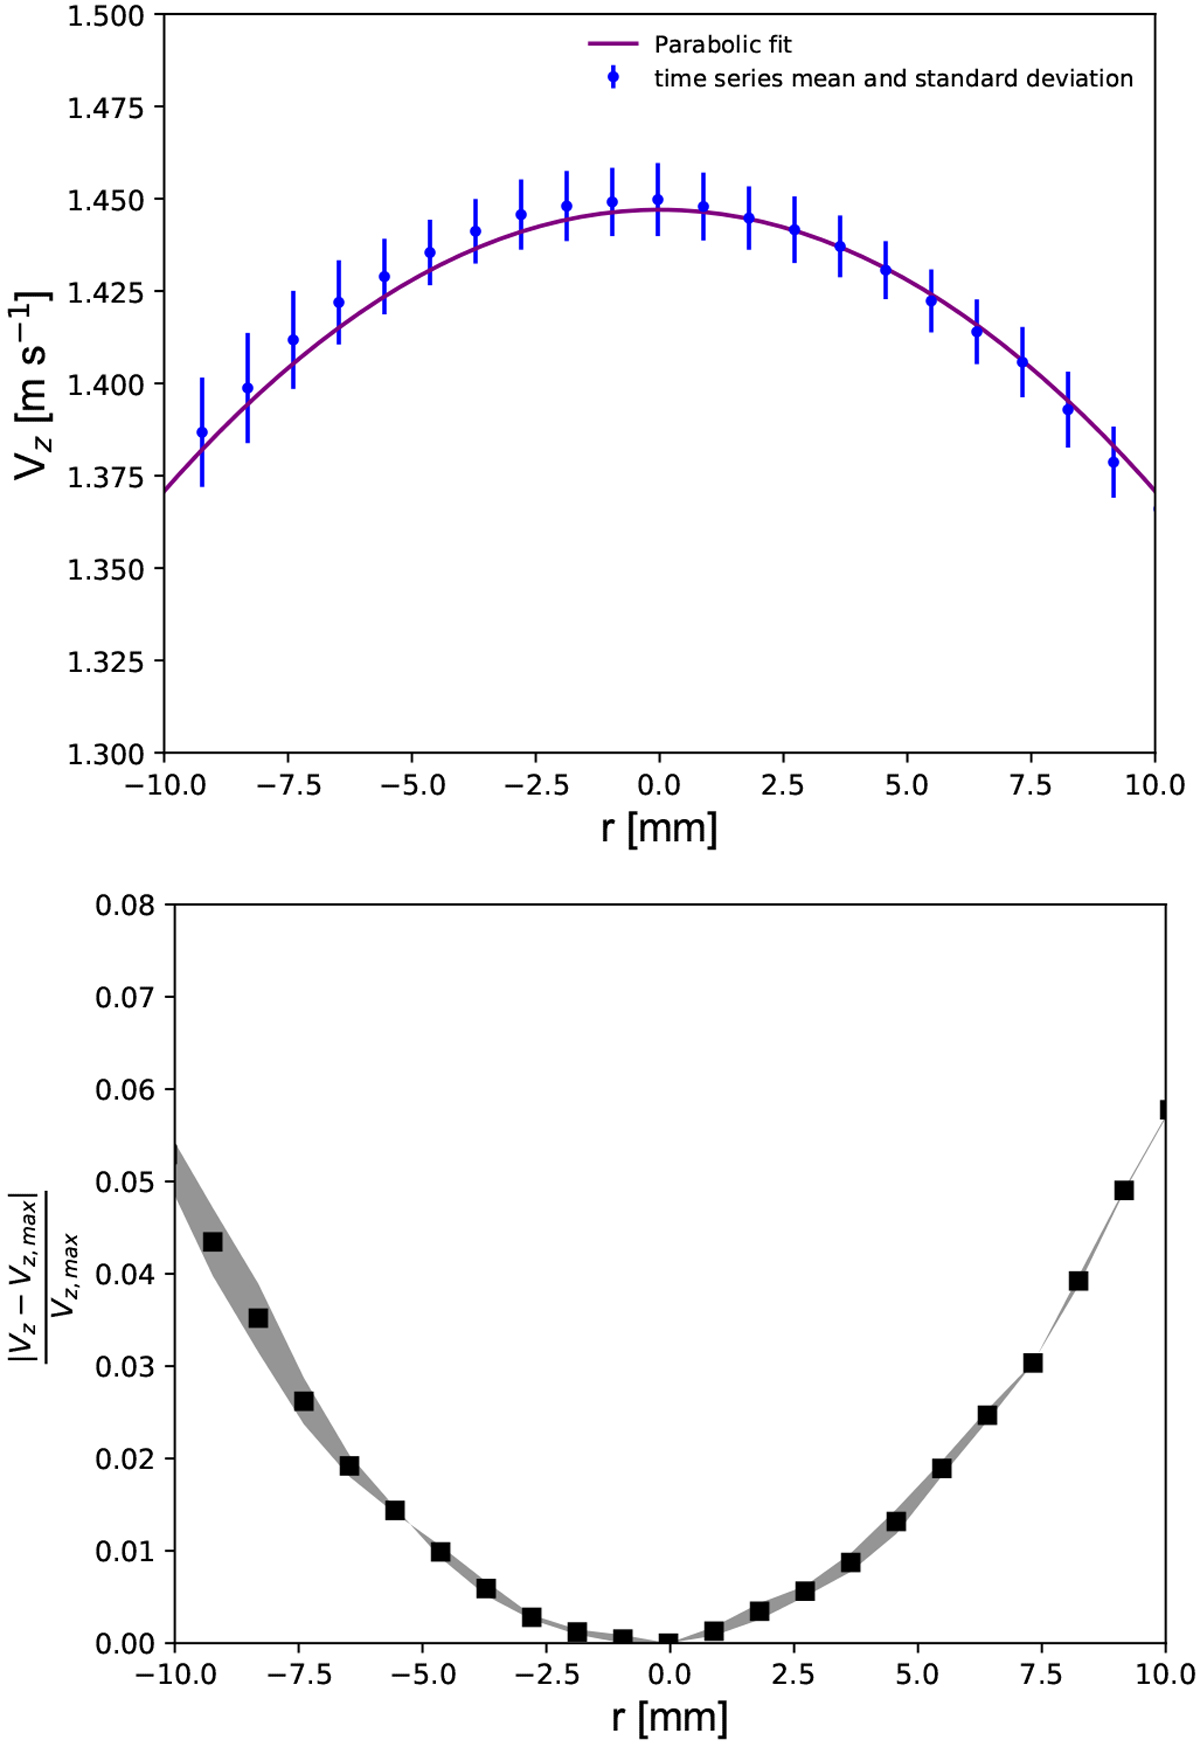
Flow profile calibration measurement using PIV, limited to the region of possible overlap with the LPT measurements, which are conducted within a ~1 cm3 region centred within the vessel with an accuracy of ~0.5 cm. Top panel: measured mean velocity (blue dots), and parabolic fit (purple line), limited to the central 2 cm of the flow vessel. Errorbars represent the standard deviation of the time-series PIV data. Bottom panel: calculation of the relative difference invelocity from the maximum centre-line velocity. The shaded region represents the uncertainty range due to error bars in the top panel.
Current usage metrics show cumulative count of Article Views (full-text article views including HTML views, PDF and ePub downloads, according to the available data) and Abstracts Views on Vision4Press platform.
Data correspond to usage on the plateform after 2015. The current usage metrics is available 48-96 hours after online publication and is updated daily on week days.
Initial download of the metrics may take a while.