Free Access
Fig. 12.
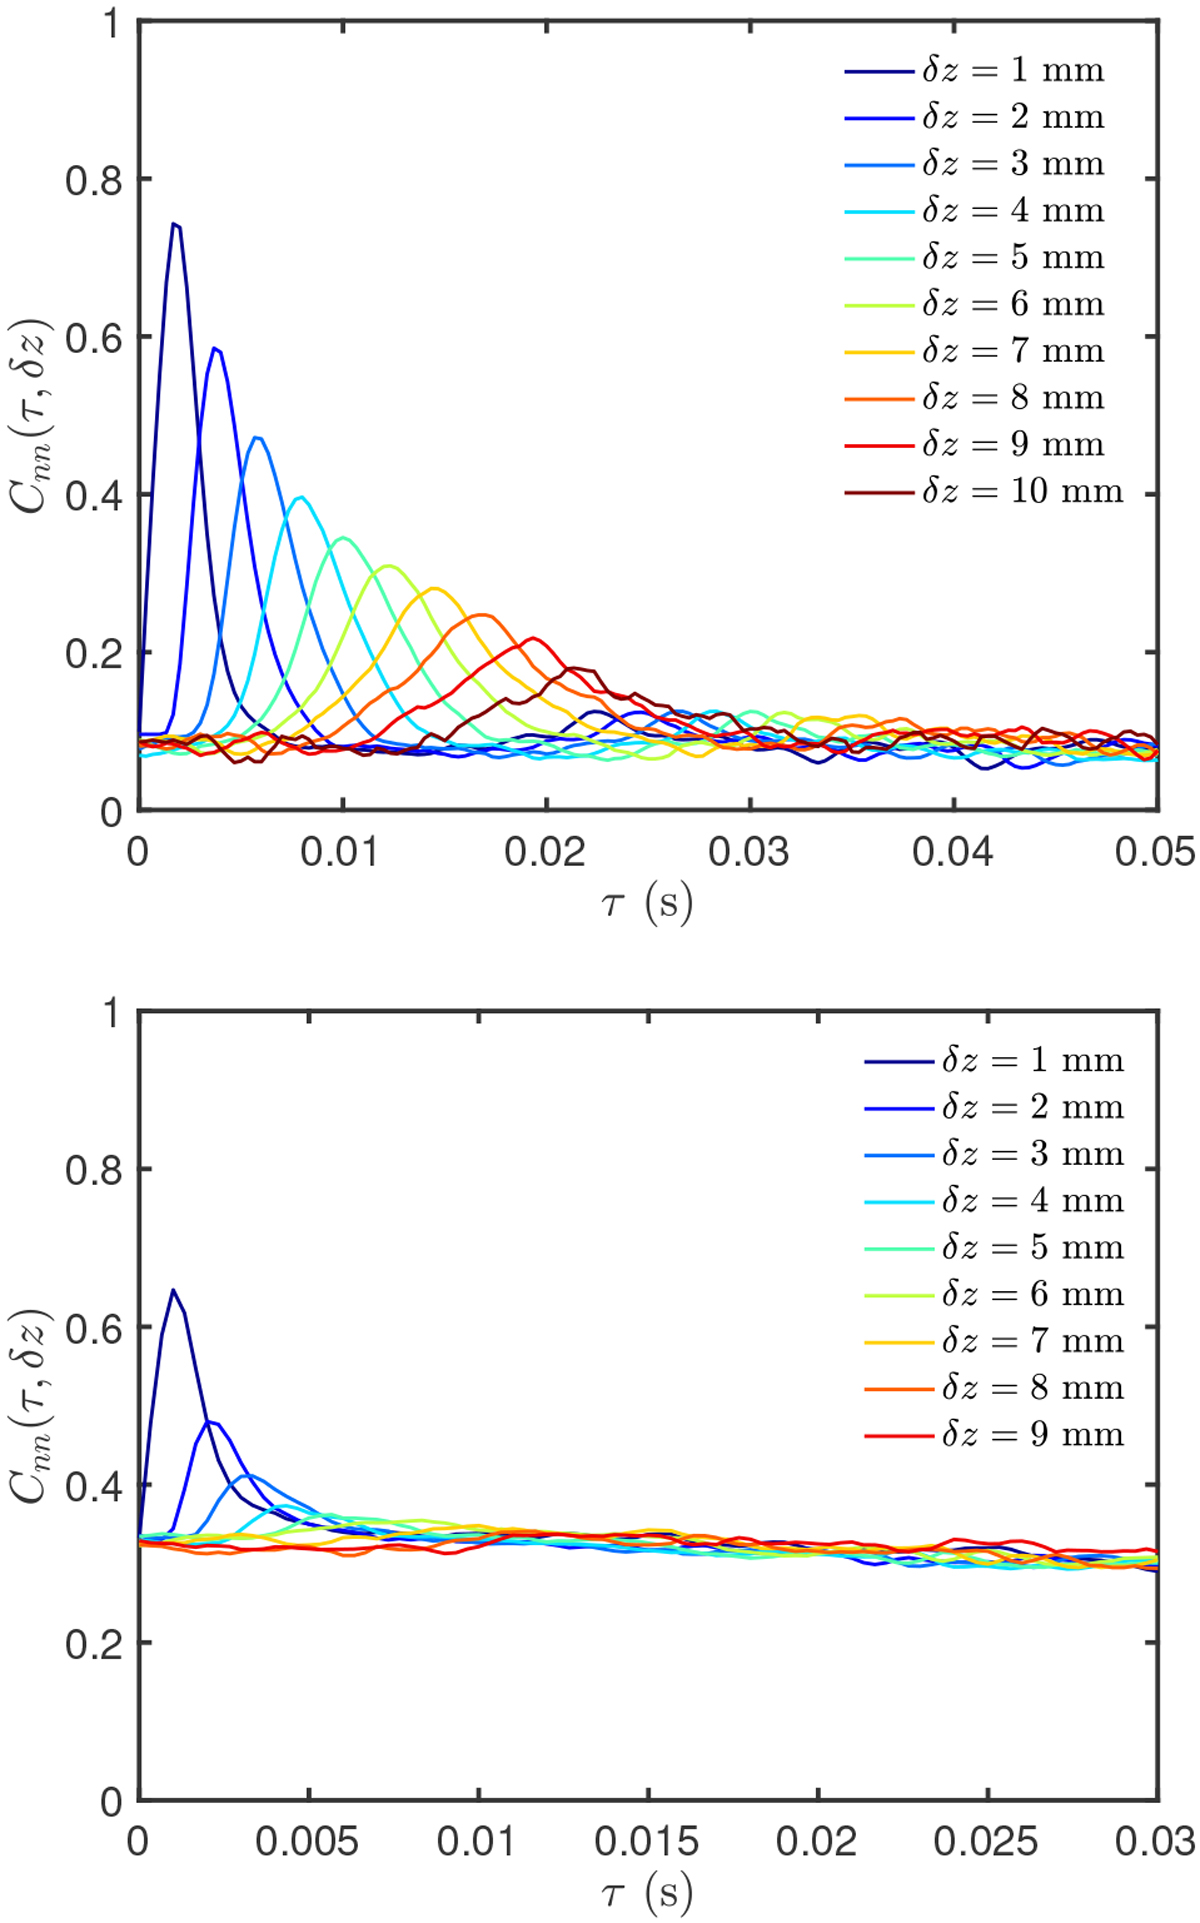
Temporal variation of the cross-correlation of particle number densities at different heights in the measurement volume. Top panel: the case of kn1_3mb [DS2]; bottom panel: kng1_8mb[DS3]. Shifting of the peaks with time and broadening of the shape indicate that the concentration evolves like an advection-diffusion process.
Current usage metrics show cumulative count of Article Views (full-text article views including HTML views, PDF and ePub downloads, according to the available data) and Abstracts Views on Vision4Press platform.
Data correspond to usage on the plateform after 2015. The current usage metrics is available 48-96 hours after online publication and is updated daily on week days.
Initial download of the metrics may take a while.