Fig. 5
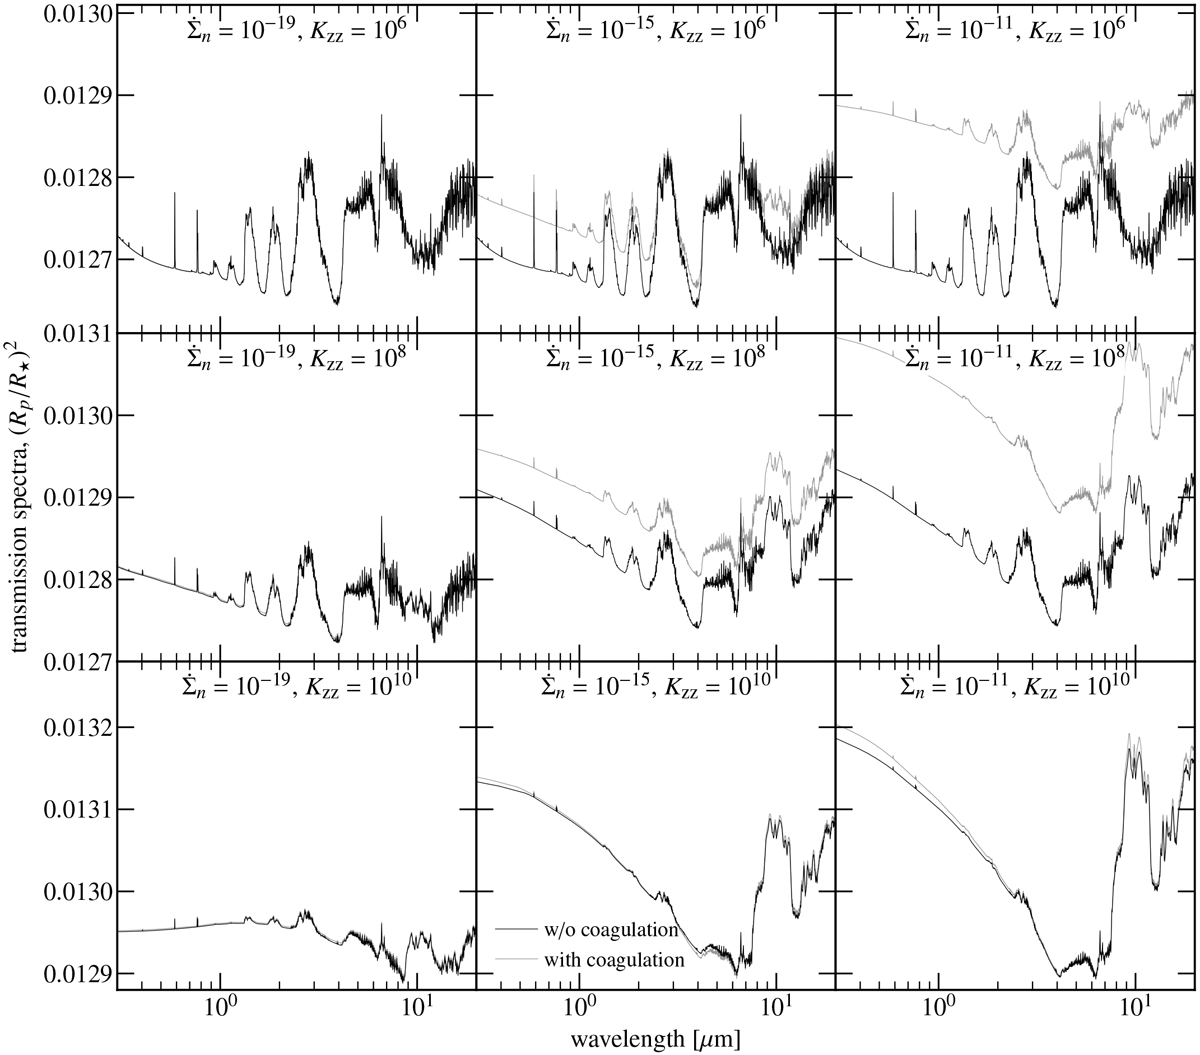
ARCiS-Simulated transmission spectra corresponding to the physical profiles presented in Fig. 3 as function of wavelength. Gray curves give the spectra without accounting for coagulation, black curves include coagulation. The scaling of the y-axis is different for the different diffusivities (higher Kzz results in a larger Rp).
Current usage metrics show cumulative count of Article Views (full-text article views including HTML views, PDF and ePub downloads, according to the available data) and Abstracts Views on Vision4Press platform.
Data correspond to usage on the plateform after 2015. The current usage metrics is available 48-96 hours after online publication and is updated daily on week days.
Initial download of the metrics may take a while.