Fig. 3
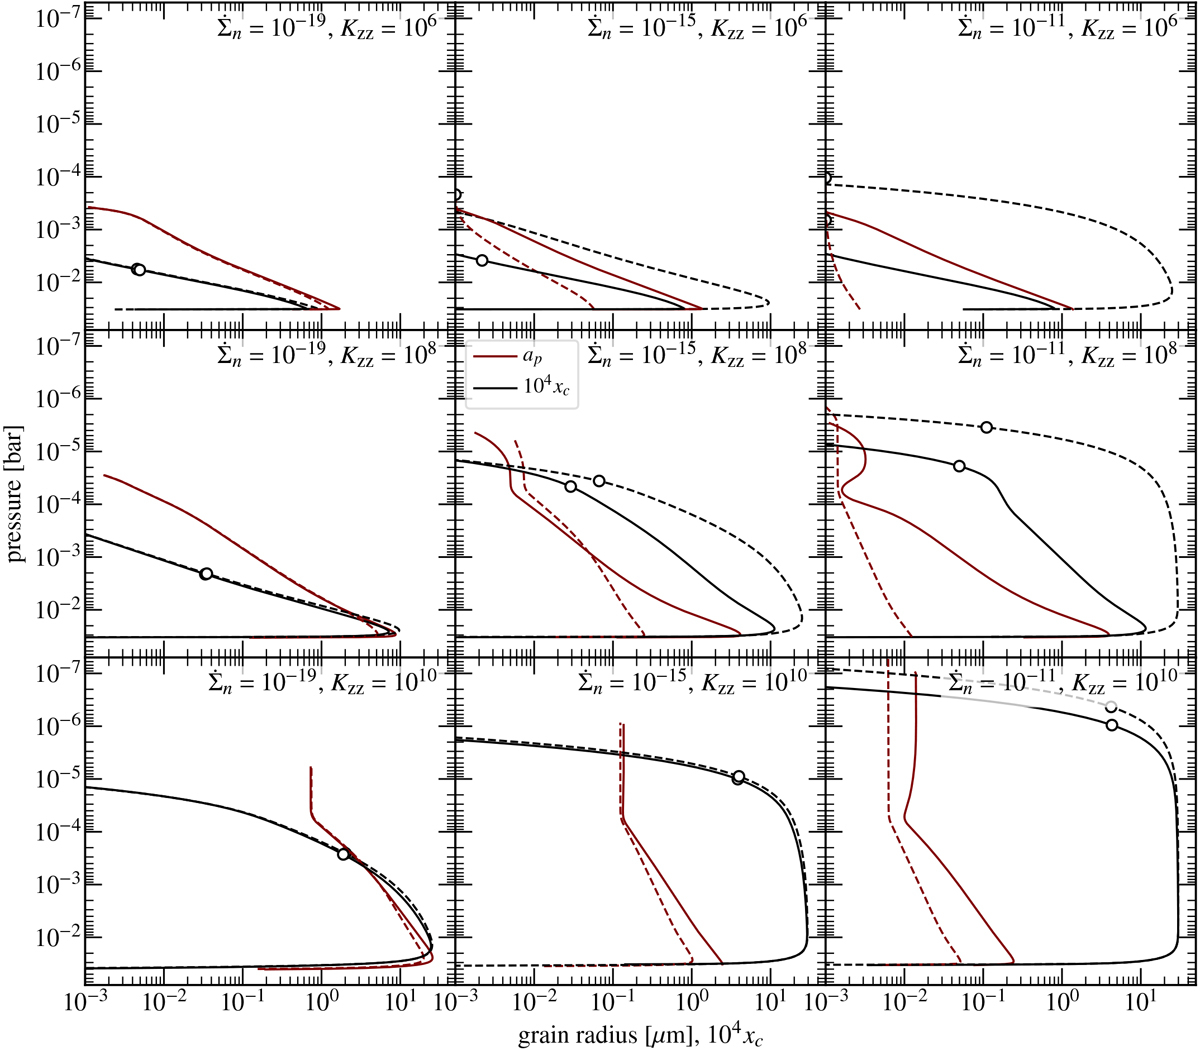
Cloud profiles. The concentration of cloud particles (black) and the characteristic particle size (dark red; shared x-axis) against pressure, plotted for combinations of diffusivities Kzz and nucleation rates ![]() (panels). The grain radius of particles in models without coagulation is shown by the dashed dark curve. The height where the transition optical depth reached unity (τtrans= 1) is indicated by the circle.
(panels). The grain radius of particles in models without coagulation is shown by the dashed dark curve. The height where the transition optical depth reached unity (τtrans= 1) is indicated by the circle.
Current usage metrics show cumulative count of Article Views (full-text article views including HTML views, PDF and ePub downloads, according to the available data) and Abstracts Views on Vision4Press platform.
Data correspond to usage on the plateform after 2015. The current usage metrics is available 48-96 hours after online publication and is updated daily on week days.
Initial download of the metrics may take a while.