Fig. 2
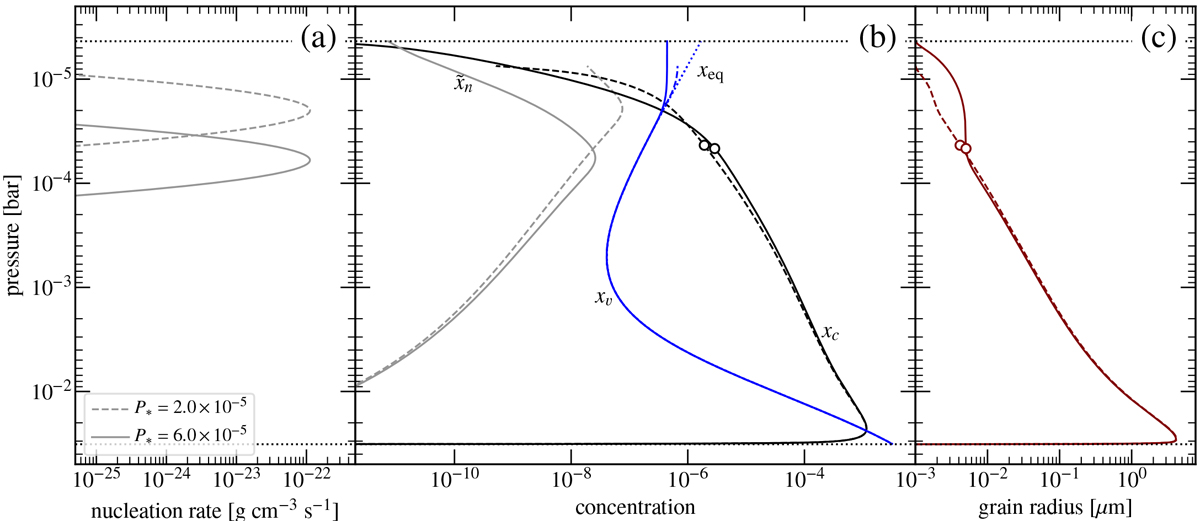
Results of the standard model (K = 108 cm2 s-1; ![]() ). Panel a: nucleation rate
). Panel a: nucleation rate ![]() , which follows a log-normal distribution around a reference pressure P*. The dotted horizontal lines indicate the bottom and top of our computational domain. Panel b: concentrations of nuclei (
, which follows a log-normal distribution around a reference pressure P*. The dotted horizontal lines indicate the bottom and top of our computational domain. Panel b: concentrations of nuclei (![]() ), condensates (xc), and vapor (xv). The equilibrium concentration corresponding to the saturation pressure is also plotted (xeq) but it virtually coincides with xv. Panel c: characteristic grain radius ap. The dashed lines correspond to a model where the nuclei are inserted at a higher layer than the standard. The open circles correspond to the depth where the geometrical transmission optical depth τtrans equals 1.
), condensates (xc), and vapor (xv). The equilibrium concentration corresponding to the saturation pressure is also plotted (xeq) but it virtually coincides with xv. Panel c: characteristic grain radius ap. The dashed lines correspond to a model where the nuclei are inserted at a higher layer than the standard. The open circles correspond to the depth where the geometrical transmission optical depth τtrans equals 1.
Current usage metrics show cumulative count of Article Views (full-text article views including HTML views, PDF and ePub downloads, according to the available data) and Abstracts Views on Vision4Press platform.
Data correspond to usage on the plateform after 2015. The current usage metrics is available 48-96 hours after online publication and is updated daily on week days.
Initial download of the metrics may take a while.