Fig. 4.
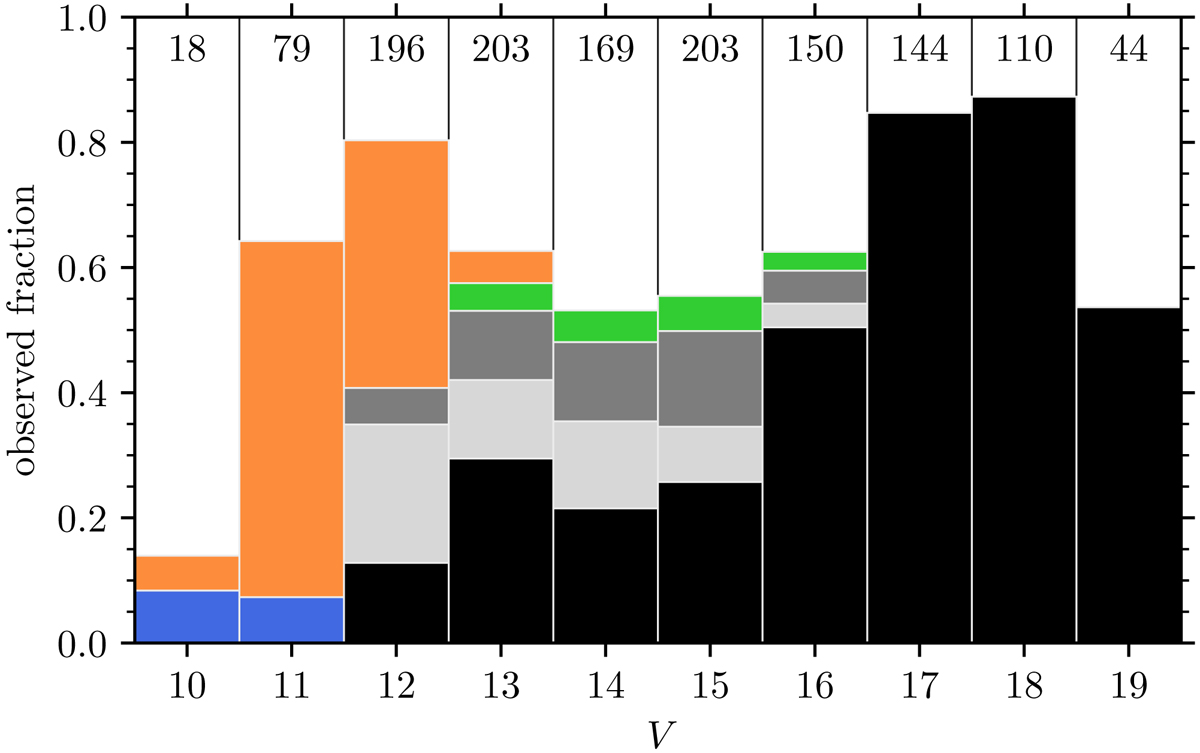
Stacked histogram of the fraction of observed photometric cluster members as a function of V. In blue we show the contribution from the RAVE survey (first two bins), in orange from Gaia DR2 (V = 10–13), and in green from the Gaia-ESO survey (V = 12–16). The components in black and light grey represent our own observations with only AAOmega and Hydra-S, respectively (V = 12–19). In dark grey we show the contribution of stars observed with both instruments (V = 12–16). The number in each above each bar indicate the total number of observed stars.
Current usage metrics show cumulative count of Article Views (full-text article views including HTML views, PDF and ePub downloads, according to the available data) and Abstracts Views on Vision4Press platform.
Data correspond to usage on the plateform after 2015. The current usage metrics is available 48-96 hours after online publication and is updated daily on week days.
Initial download of the metrics may take a while.