Fig. 8.
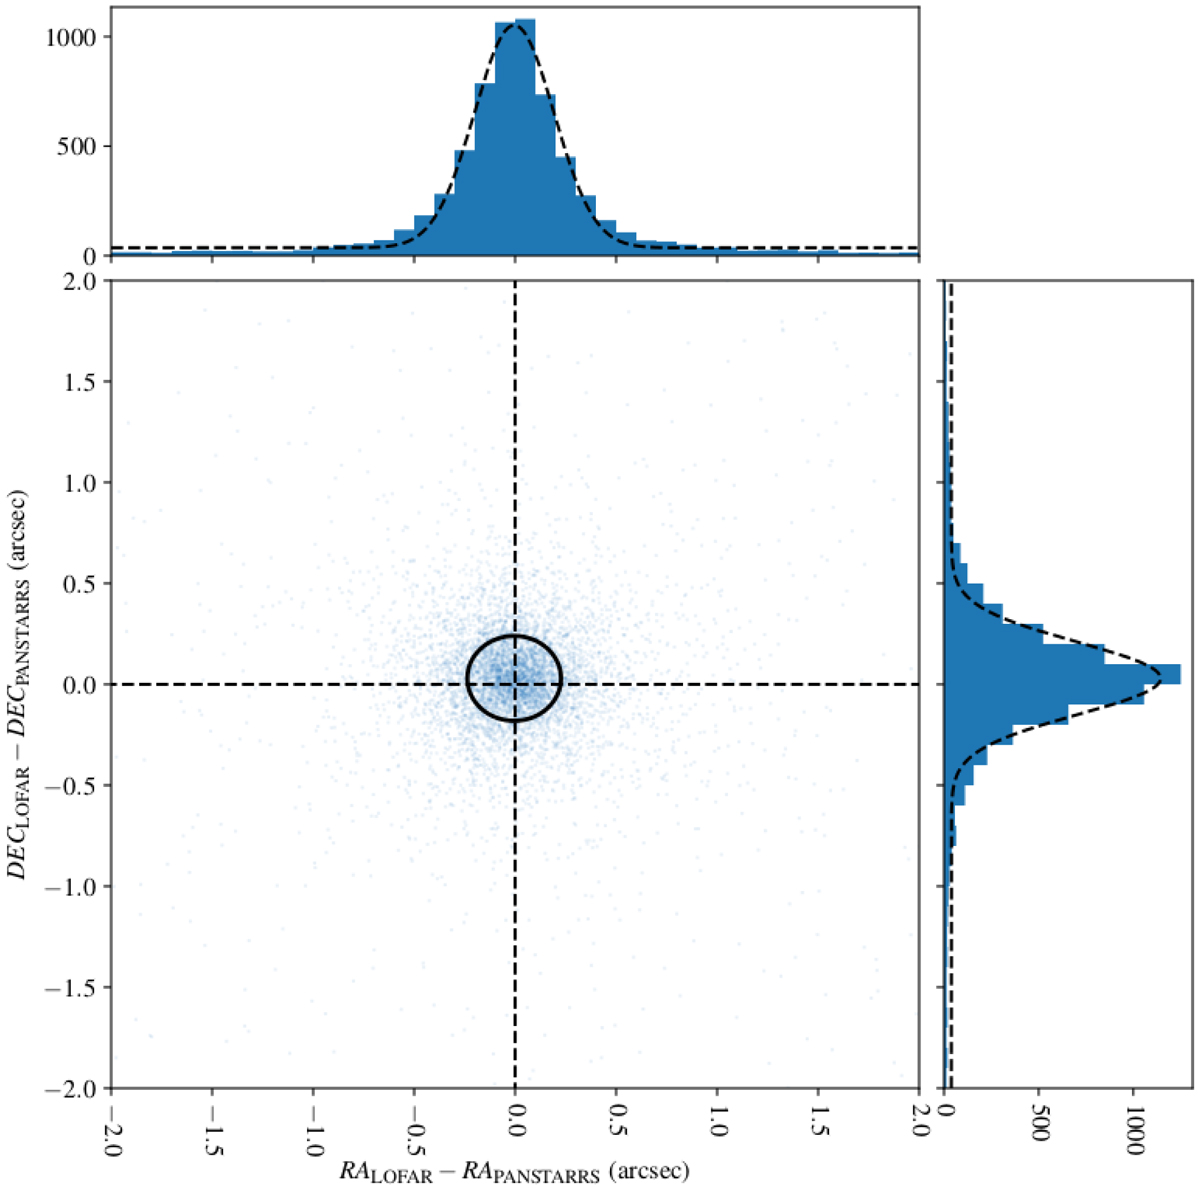
Residual RA and Dec offsets for LOFAR detected sources matched with their Pan-STARRS counterparts. The histograms show the number of sources at various RA and Dec offsets and the ellipse shows the peak location (less than 0.02″ from the centre in both RA and Dec) and the FWFM (σ ≈ 0.2″) of the Gaussian functions that are fitted to the histograms of the offsets. Similar plots showing the same LoTSS-DR1 sources cross-matched with WISE or FIRST sources show comparable systematic offsets and standard deviations of less than 0.27″ and 0.3″, respectively.
Current usage metrics show cumulative count of Article Views (full-text article views including HTML views, PDF and ePub downloads, according to the available data) and Abstracts Views on Vision4Press platform.
Data correspond to usage on the plateform after 2015. The current usage metrics is available 48-96 hours after online publication and is updated daily on week days.
Initial download of the metrics may take a while.