Fig. 13.
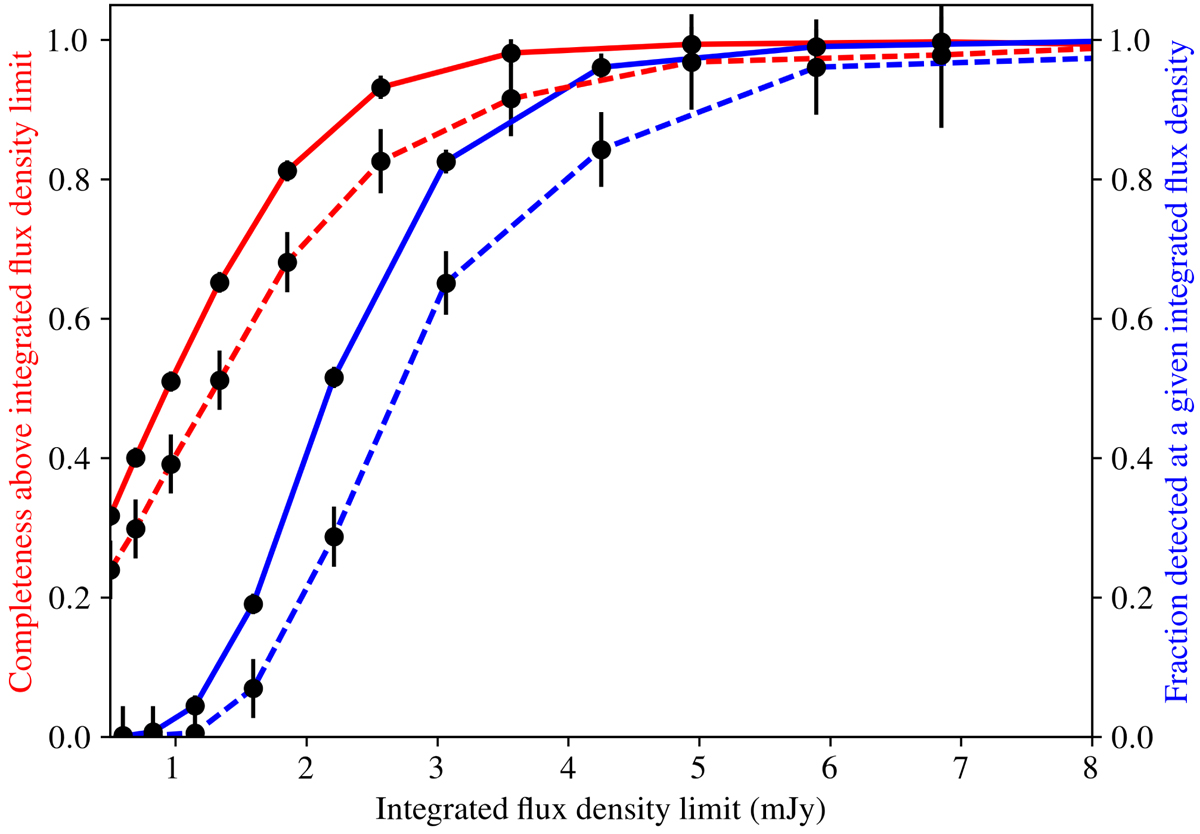
Estimated point-source completeness for a 10 SB (1/24th of the data) for a single LoTSS-DR1 pointing. The red line shows the completeness above a given integrated flux density and the blue line shows the fraction of sources detected at a specific integrated flux density value. The solid lines show the results of the simulation in which point sources are injected into PyBDSF residual images and the dashed lines show results from when delta functions corrupted by realistic direction-dependent errors are injected into the uν-data before it is run through LoTSS-DR1. The error bars give the Poisson errors.
Current usage metrics show cumulative count of Article Views (full-text article views including HTML views, PDF and ePub downloads, according to the available data) and Abstracts Views on Vision4Press platform.
Data correspond to usage on the plateform after 2015. The current usage metrics is available 48-96 hours after online publication and is updated daily on week days.
Initial download of the metrics may take a while.