Free Access
Fig. 12.
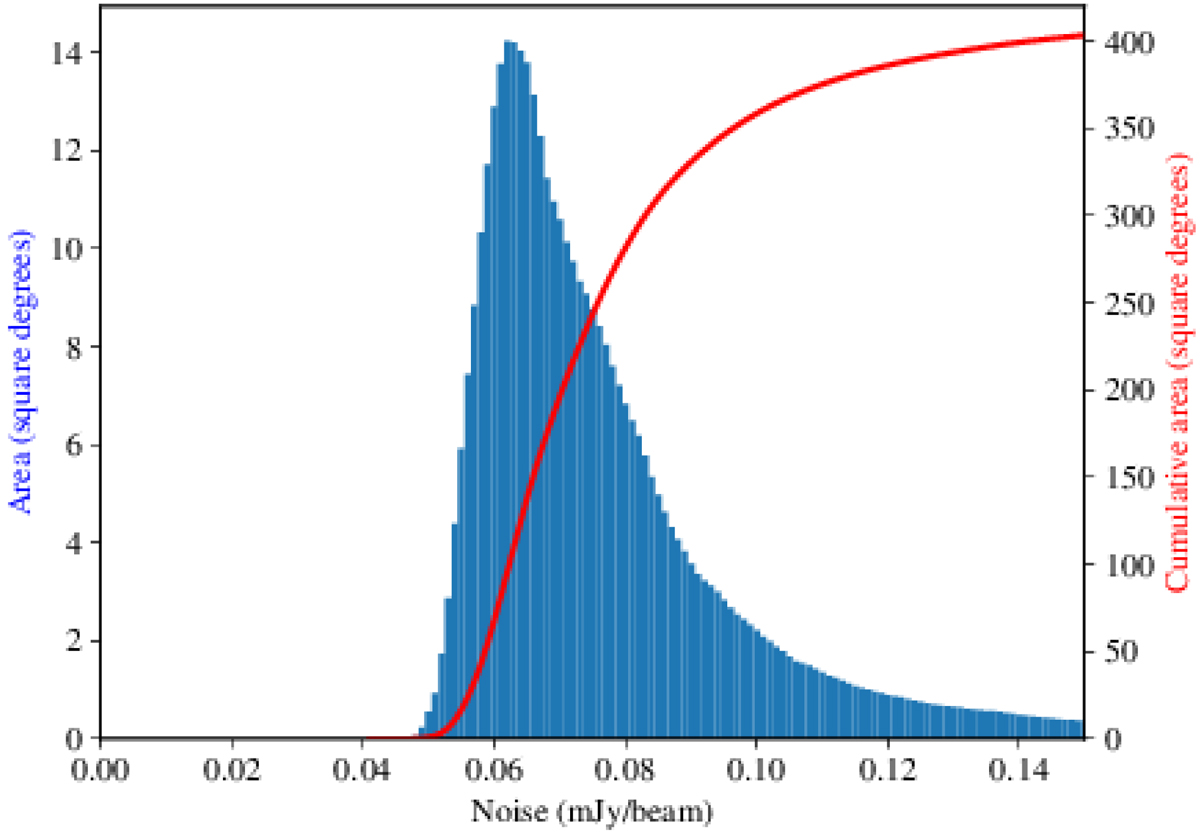
Estimated noise variations on the direction-dependent calibrated LoTSS-DR1 images. The red line shows the cumulative area of the mosaiced region that has an estimated noise less than a given value. The histogram shows the distribution of noise estimates within the mosaiced region.
Current usage metrics show cumulative count of Article Views (full-text article views including HTML views, PDF and ePub downloads, according to the available data) and Abstracts Views on Vision4Press platform.
Data correspond to usage on the plateform after 2015. The current usage metrics is available 48-96 hours after online publication and is updated daily on week days.
Initial download of the metrics may take a while.