Fig. 10.
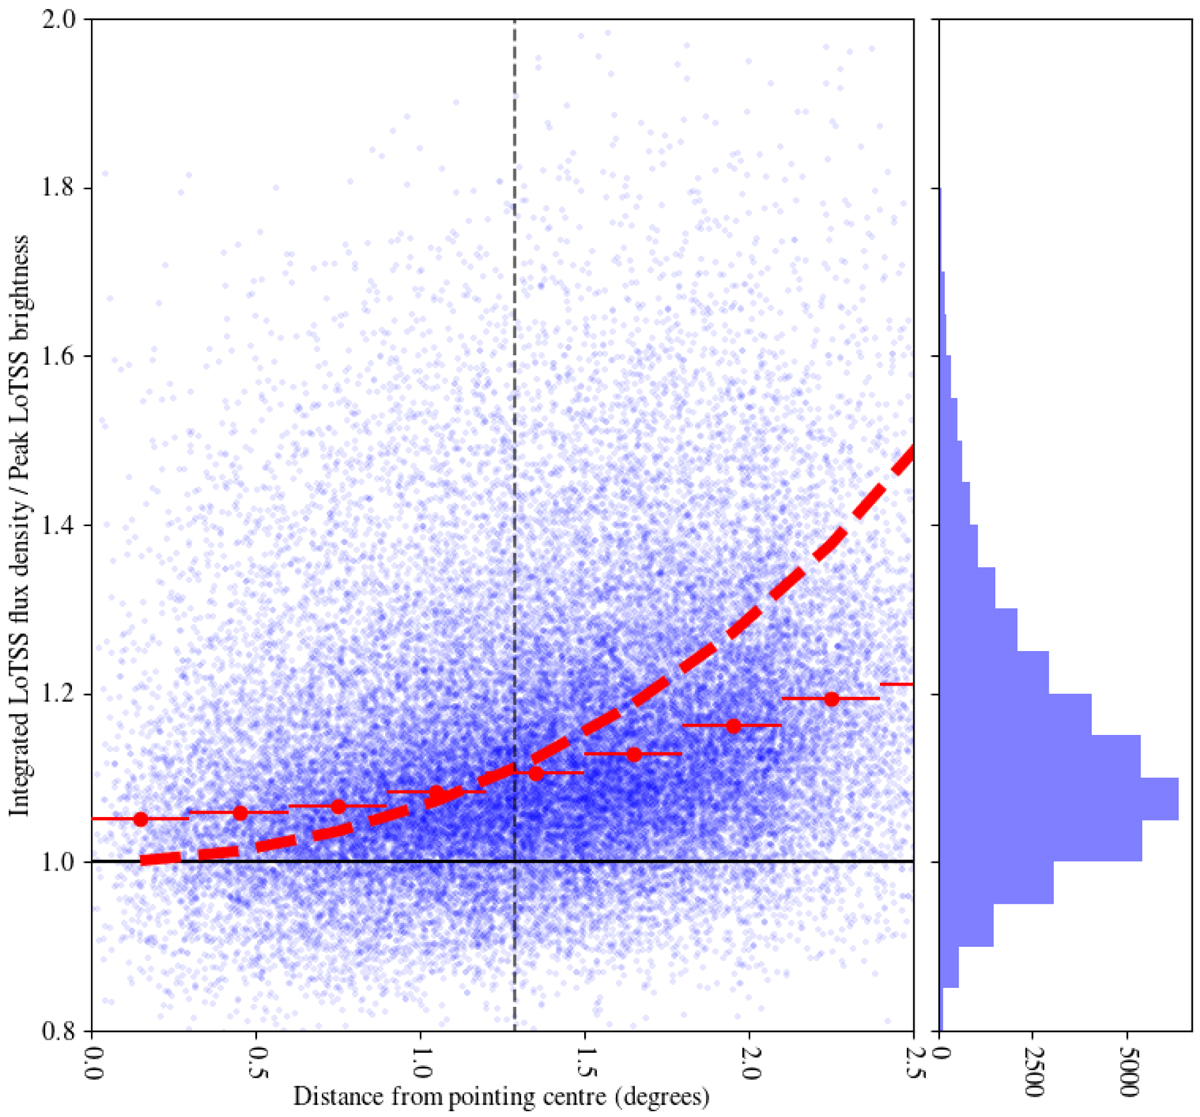
Integrated flux density to peak brightness ratios of compact LoTSS-DR1 sources as a function of separation from the pointing centre for catalogues derived from individual LoTSS-DR1 pointings. The thick red curve shows the approximate ratio expected from time and bandwidth smearing assuming that unresolved sources have a ratio of 1.0. The effects of time and bandwidth smearing are taken into account during deconvolution in DDFacet. The red points show the median ratios within bins of distance; the 95% confidence intervals are ∼0.02 and were estimated by the bootstrap method. The horizontal errors bars give the bin width and the vertical dashed line shows the median distance between LoTSS pointings.
Current usage metrics show cumulative count of Article Views (full-text article views including HTML views, PDF and ePub downloads, according to the available data) and Abstracts Views on Vision4Press platform.
Data correspond to usage on the plateform after 2015. The current usage metrics is available 48-96 hours after online publication and is updated daily on week days.
Initial download of the metrics may take a while.