Free Access
Fig. 7
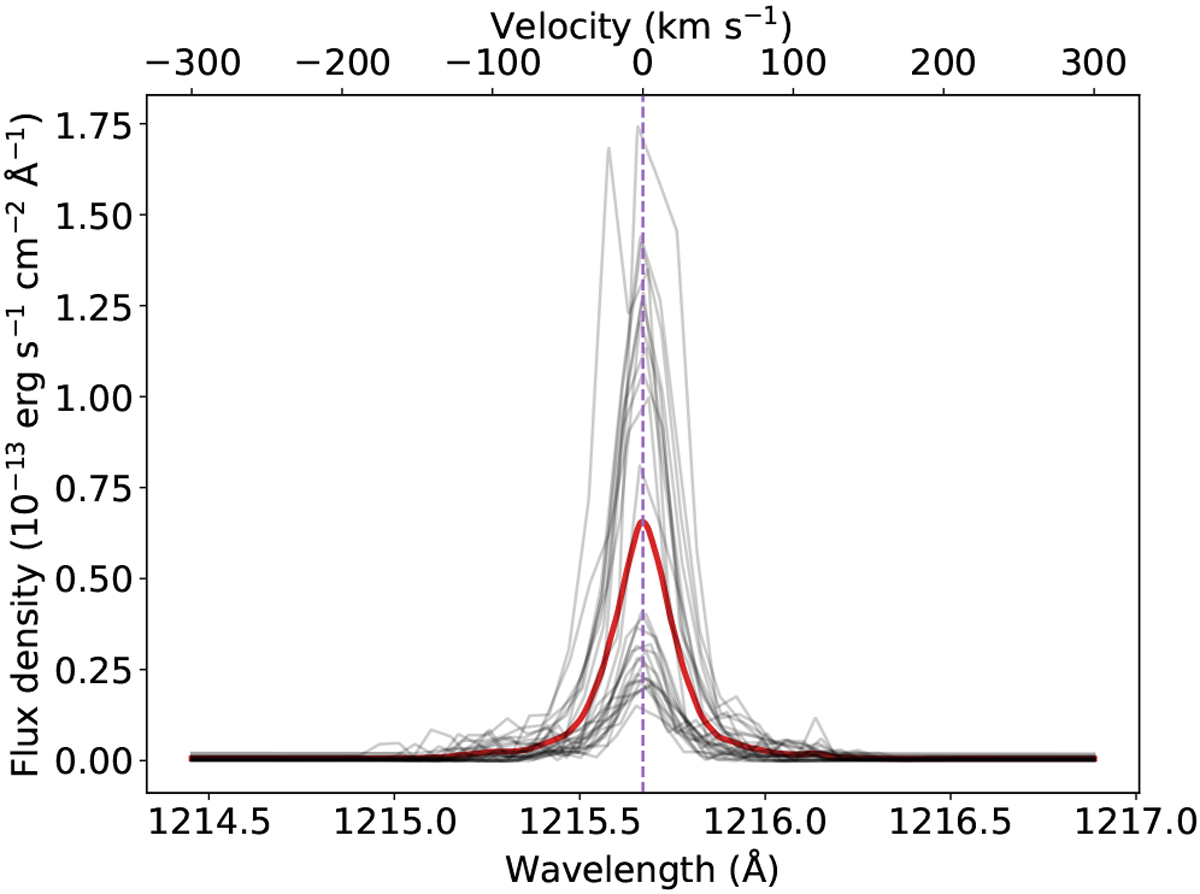
Mean geocoronal emission of the Earth as measured with HST/STIS during 27 observations (red spectrum). The gray spectracorrespond to the different exposures. The emission lines were aligned to the rest frame of the telescope by fitting Gaussians to each exposure.
Current usage metrics show cumulative count of Article Views (full-text article views including HTML views, PDF and ePub downloads, according to the available data) and Abstracts Views on Vision4Press platform.
Data correspond to usage on the plateform after 2015. The current usage metrics is available 48-96 hours after online publication and is updated daily on week days.
Initial download of the metrics may take a while.