Free Access
Fig. 4
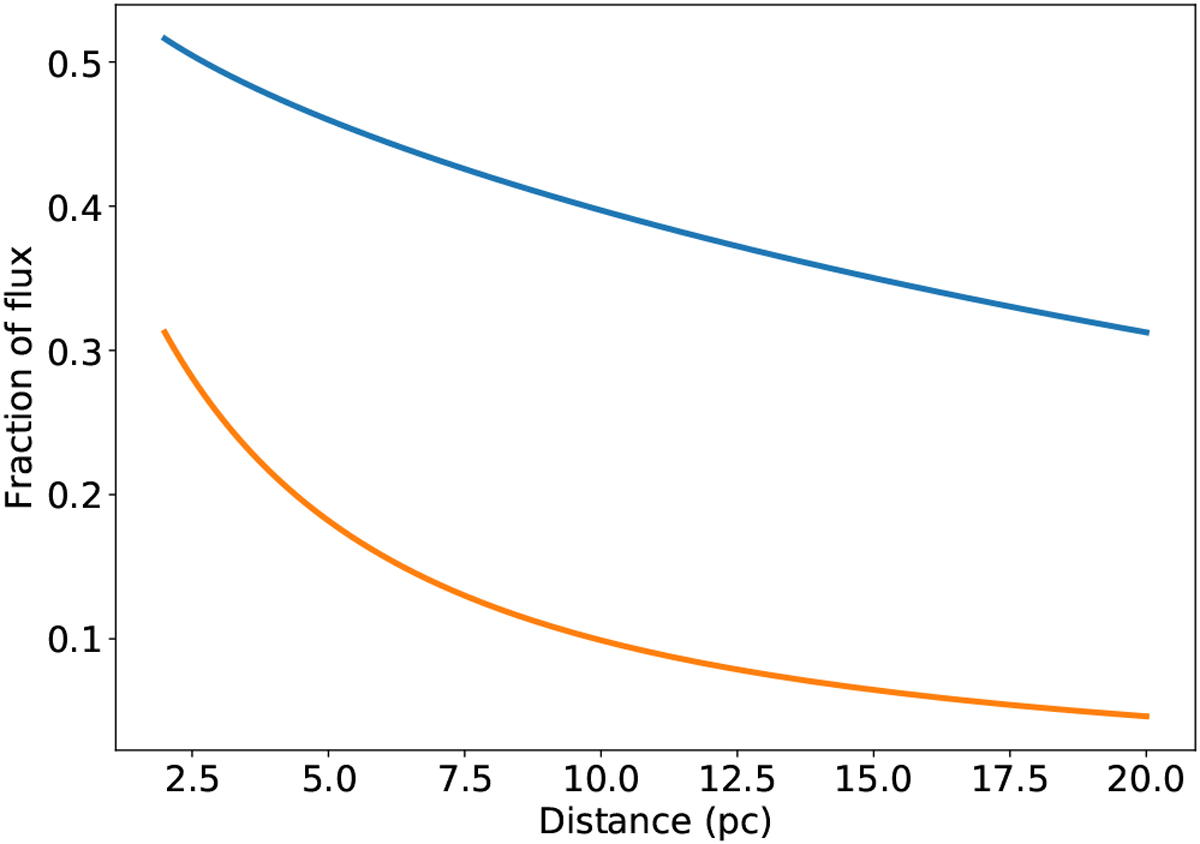
Observed fraction of the intrinsic Lyman-α flux as a function of distance after ISM absorption. The blue (orange) curve represents the attenuation in the lowest (highest) density of the LIC.
Current usage metrics show cumulative count of Article Views (full-text article views including HTML views, PDF and ePub downloads, according to the available data) and Abstracts Views on Vision4Press platform.
Data correspond to usage on the plateform after 2015. The current usage metrics is available 48-96 hours after online publication and is updated daily on week days.
Initial download of the metrics may take a while.