Free Access
Fig. 12
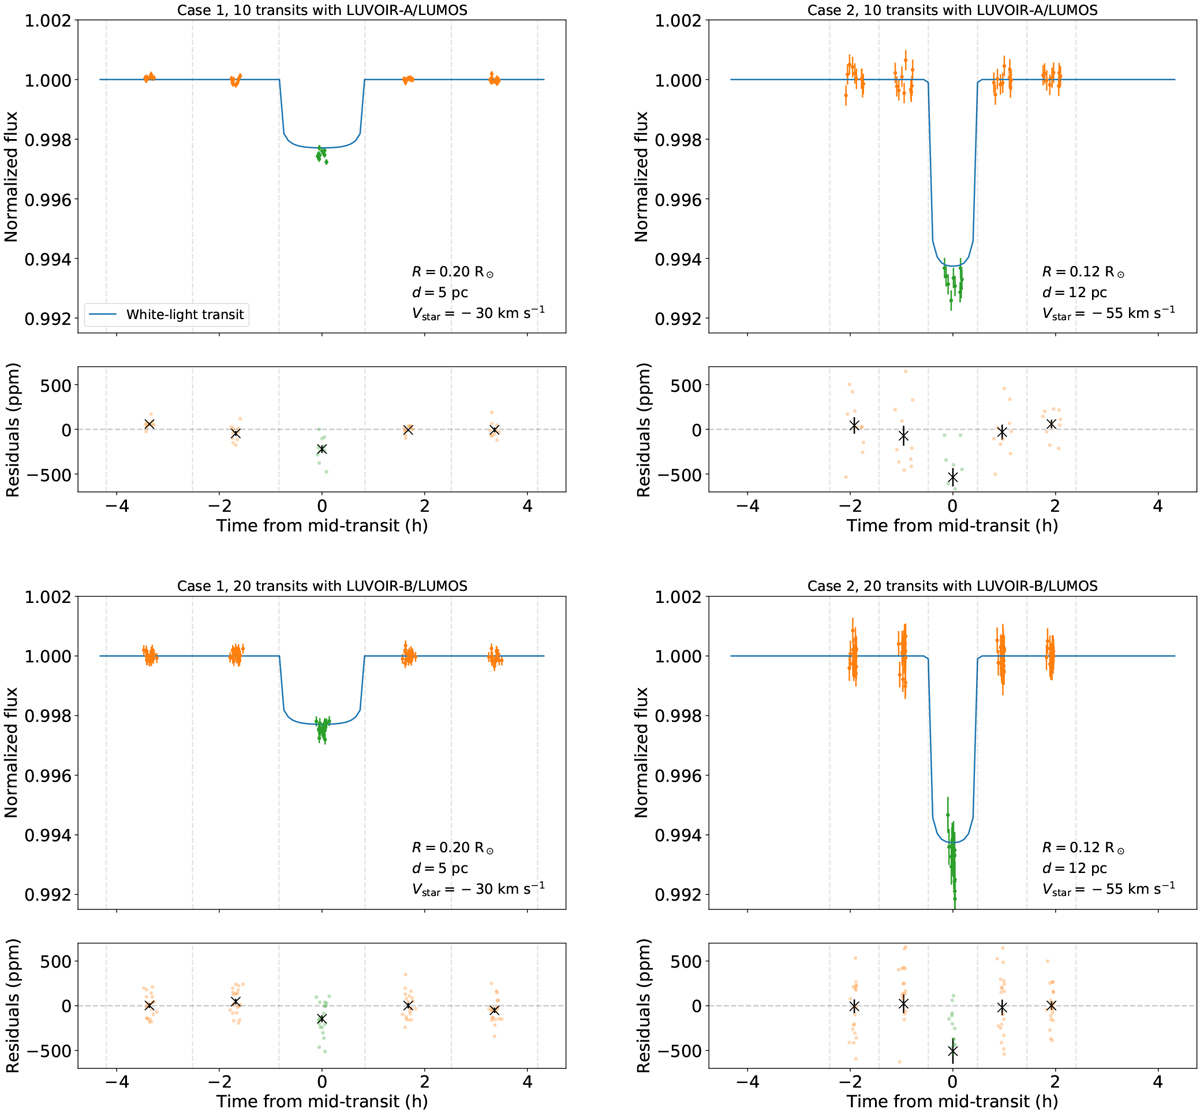
Transit light curves of our test cases. The vertical dashed lines separate the different exposures (5 in total for each transit; the exposure time for each data point is equal to the transit duration).
Current usage metrics show cumulative count of Article Views (full-text article views including HTML views, PDF and ePub downloads, according to the available data) and Abstracts Views on Vision4Press platform.
Data correspond to usage on the plateform after 2015. The current usage metrics is available 48-96 hours after online publication and is updated daily on week days.
Initial download of the metrics may take a while.