Fig. 8
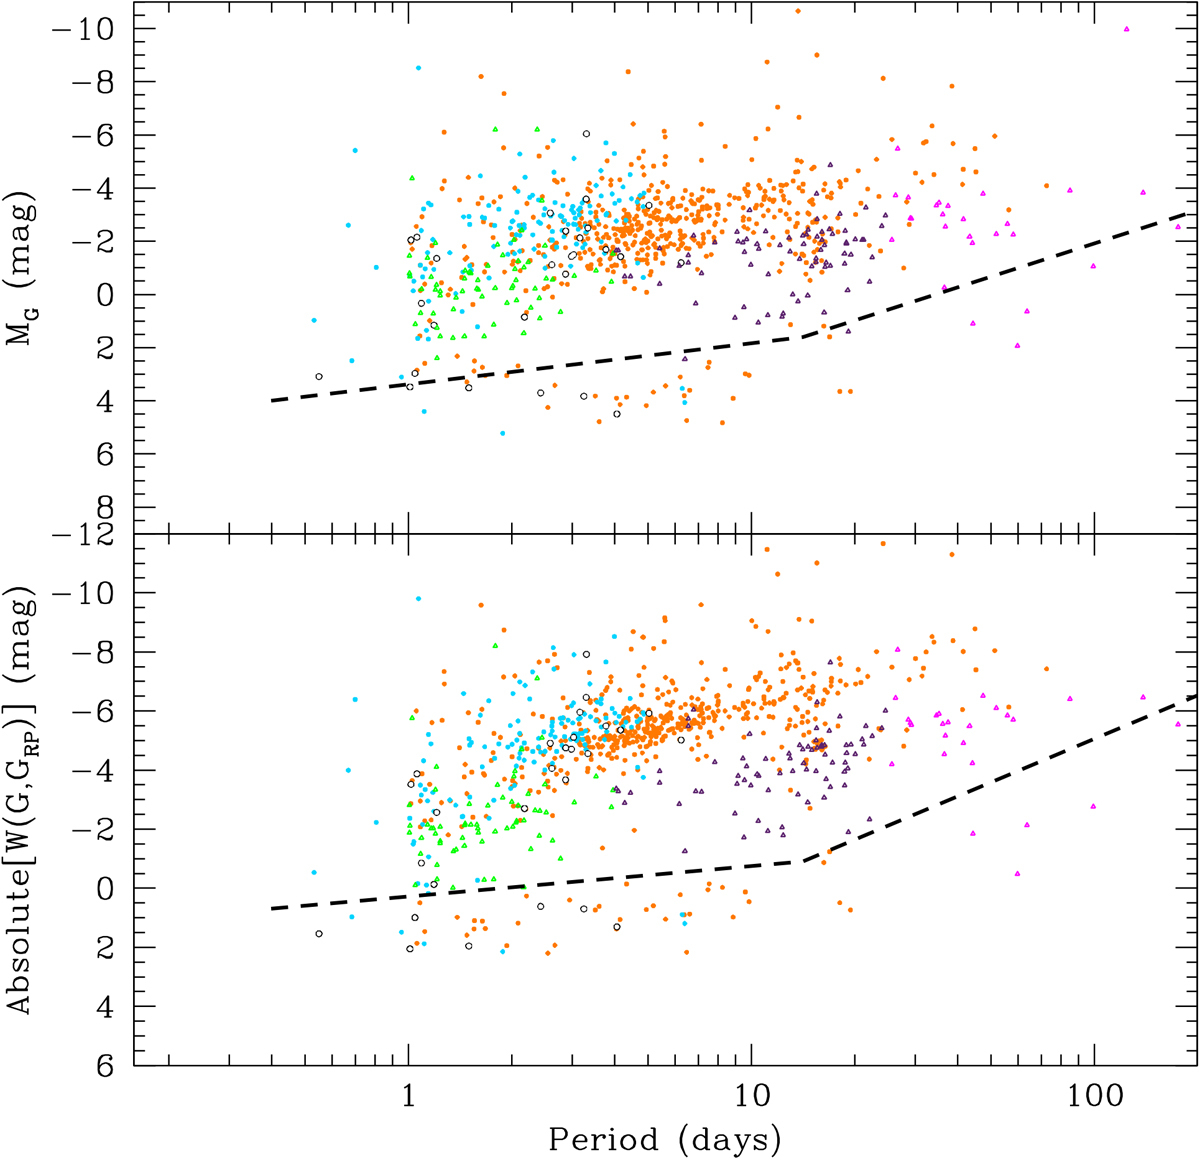
Upper panel: G-band PL distribution in absolute G magnitude not corrected for extinction of All-Sky DCEPs and T2CEPs known in the literature. Lower panel: period–absolute(W(G, GRP)) distributionof All-Sky DCEPs and T2CEPs known in the literature. Symbols and colour-coding are the same as in Fig. 6. The dashed lines in each panel indicate the regions below which the sources may be misclassifications (spurious sources) or may be bona fide Cepheids with an incorrect parallax value that is due to the still simplified astrometric processing applied for DR2, among which in particular the lack of a proper treatment of binary or multiple sources (see Sect. 3.2 and Ripepi et al. 2018, for more details).
Current usage metrics show cumulative count of Article Views (full-text article views including HTML views, PDF and ePub downloads, according to the available data) and Abstracts Views on Vision4Press platform.
Data correspond to usage on the plateform after 2015. The current usage metrics is available 48-96 hours after online publication and is updated daily on week days.
Initial download of the metrics may take a while.