Fig. 6
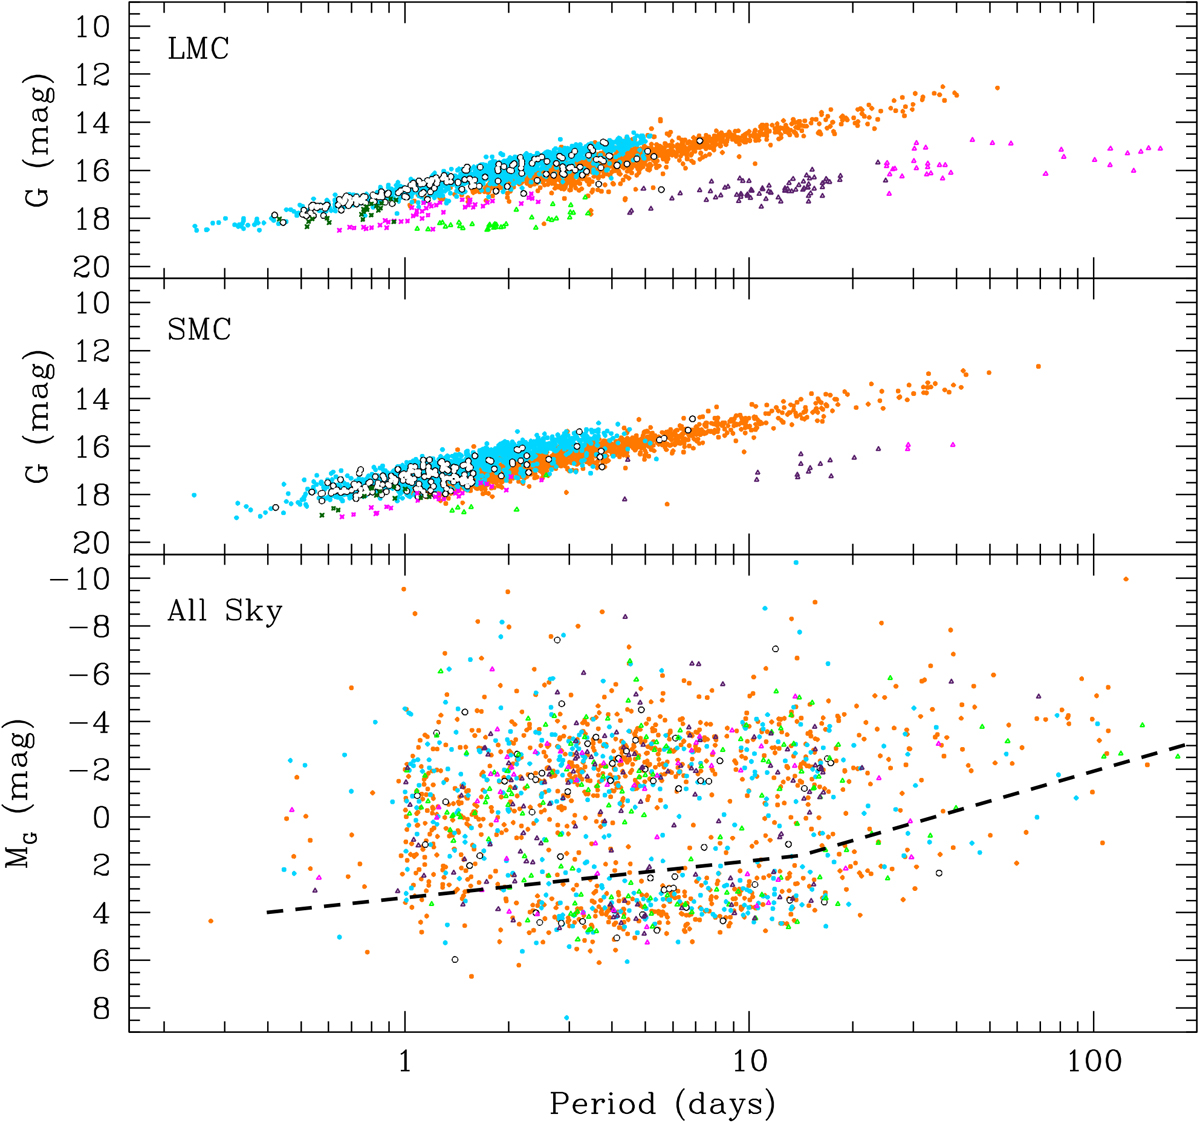
Upper and middle panels: G-band PL distribution in apparent magnitude not corrected for reddening of DCEPs, ACEPs, and T2CEPs in the LMC and SMC, respectively. Lower panel: PL distribution in absolute G magnitude (MG) not corrected for extinction of All-Sky Cepheids of the different types. Orange filled circles: DCEPs F; cyan filledcircles: DECPs 1O; blank filled circles: multi-mode DCEPs; magenta four-stars: ACEPs F; dark green four-stars: ACEPS 1O; green open triangles: BL Her; violet open triangles: W Vir; magenta open triangles: RV Tau. The much larger scatter of the All-Sky Cepheid PL distribution is clearly visible: the Y -axis in the lowerpanel of the figure spans a magnitude range of 20.0 mag, to compare with the 11.5 mag range of the two upper panels. Several All-Sky sources lie below the dashed line in the lower panel of the figure. They are a mix of misclassifications (spurious sources), sources with very high reddening, and Cepheids with an incorrect parallax value that is due to the still simplified astrometric processing applied for DR2, among which in particular the lack of a proper treatment of binary or multiple sources (see Sect. 3.2 and Ripepi et al. 2018, for more details).
Current usage metrics show cumulative count of Article Views (full-text article views including HTML views, PDF and ePub downloads, according to the available data) and Abstracts Views on Vision4Press platform.
Data correspond to usage on the plateform after 2015. The current usage metrics is available 48-96 hours after online publication and is updated daily on week days.
Initial download of the metrics may take a while.