Fig. 2
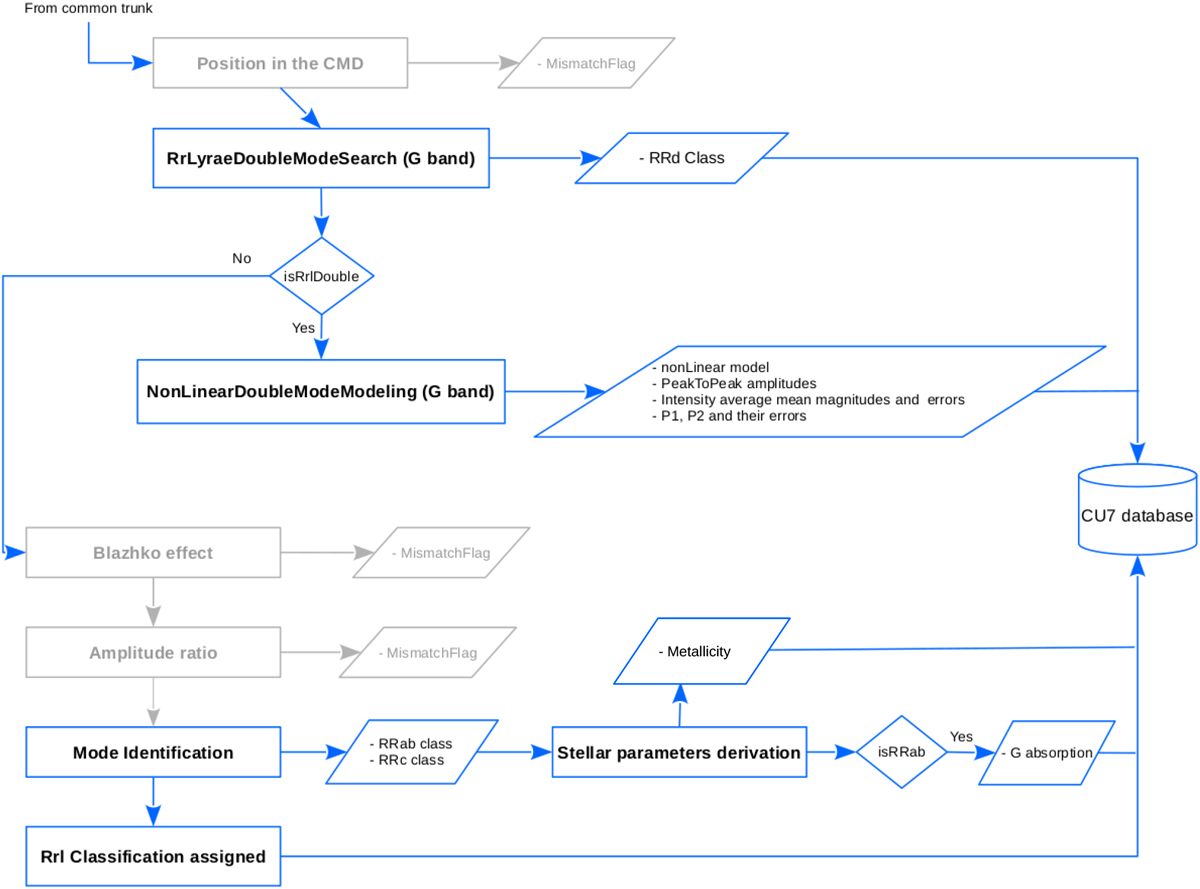
Flow chart of the RR Lyrae branch in the SOS Cep&RRL pipeline. As in Fig. 1, rectangles show the differentprocessing modules (with names highlighted in boldface) of this branch. Their outputs are indicated within parallelograms. Rhombi indicate filters leading to different processing options. We mark in light grey modules that were not operational for the Gaia DR2 processing. The figure is updated from Fig. 2 of Paper 1 to include modifications that were implemented to process the DR2 photometry.
Current usage metrics show cumulative count of Article Views (full-text article views including HTML views, PDF and ePub downloads, according to the available data) and Abstracts Views on Vision4Press platform.
Data correspond to usage on the plateform after 2015. The current usage metrics is available 48-96 hours after online publication and is updated daily on week days.
Initial download of the metrics may take a while.