Fig. 19
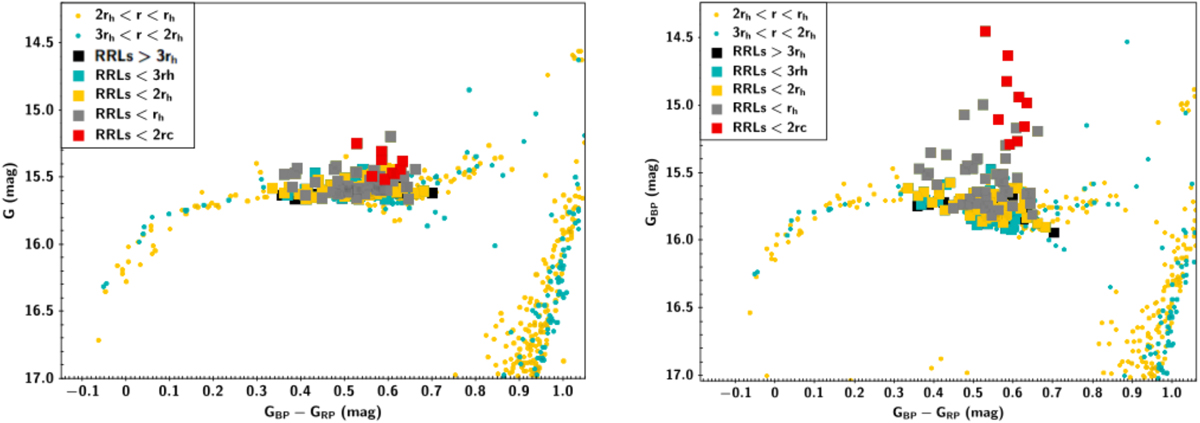
Left panel: zoom of the HB region in the G vs GBP –GRP CMD of M3. RR Lyrae stars are plotted as filled squares and with different colours according to their position with respect to the cluster centre. The same colour-coding is adopted as in the left panelof Fig.18, and black filled squares show the variables beyond three times rh. Right panel: same as in the left panel, but for the GBP vs. GBP–GRP CMD.
Current usage metrics show cumulative count of Article Views (full-text article views including HTML views, PDF and ePub downloads, according to the available data) and Abstracts Views on Vision4Press platform.
Data correspond to usage on the plateform after 2015. The current usage metrics is available 48-96 hours after online publication and is updated daily on week days.
Initial download of the metrics may take a while.