Fig. 13
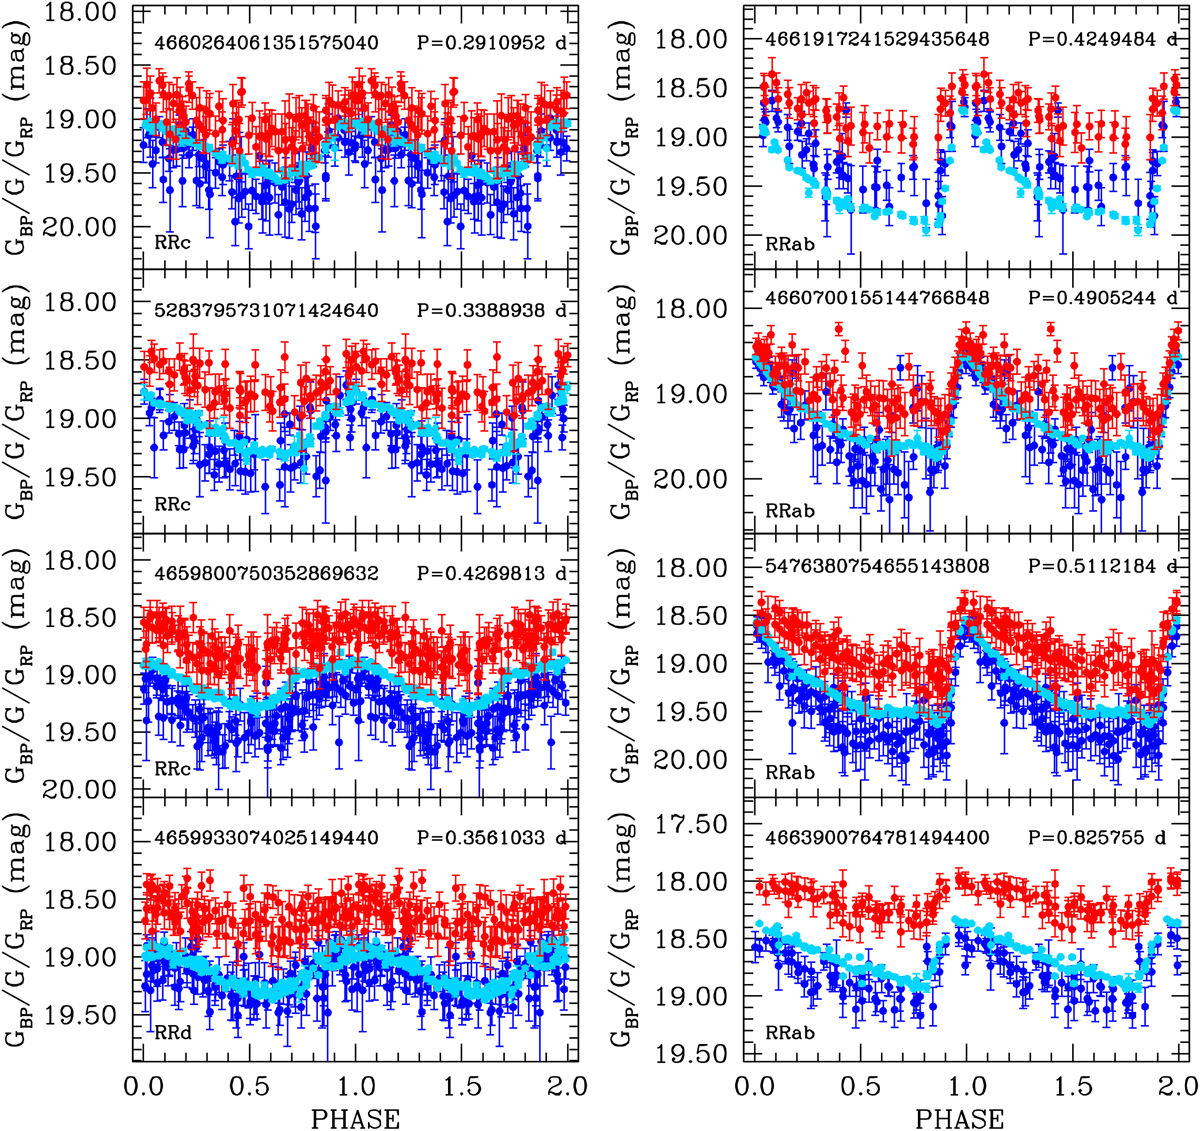
G (cyan), GBP (blue), and GRP (red) light curves of RR Lyrae stars of different pulsation mode in the LMC and SMC, released in Gaia DR2. The multi-band time-series data are folded according to the period and epoch of maximum light derived by the SOS Cep&RRL pipeline. Although the errors are larger than in the G band, the colour light curves are well defined. The GBP light curve of the RR Lyrae star in the top right panel is brighter and has a lower amplitude than the G-band curve, likely because the star is blended with a companion that contaminates the GBP photometry (see Sect. 4.1 for details).
Current usage metrics show cumulative count of Article Views (full-text article views including HTML views, PDF and ePub downloads, according to the available data) and Abstracts Views on Vision4Press platform.
Data correspond to usage on the plateform after 2015. The current usage metrics is available 48-96 hours after online publication and is updated daily on week days.
Initial download of the metrics may take a while.