Fig. 12
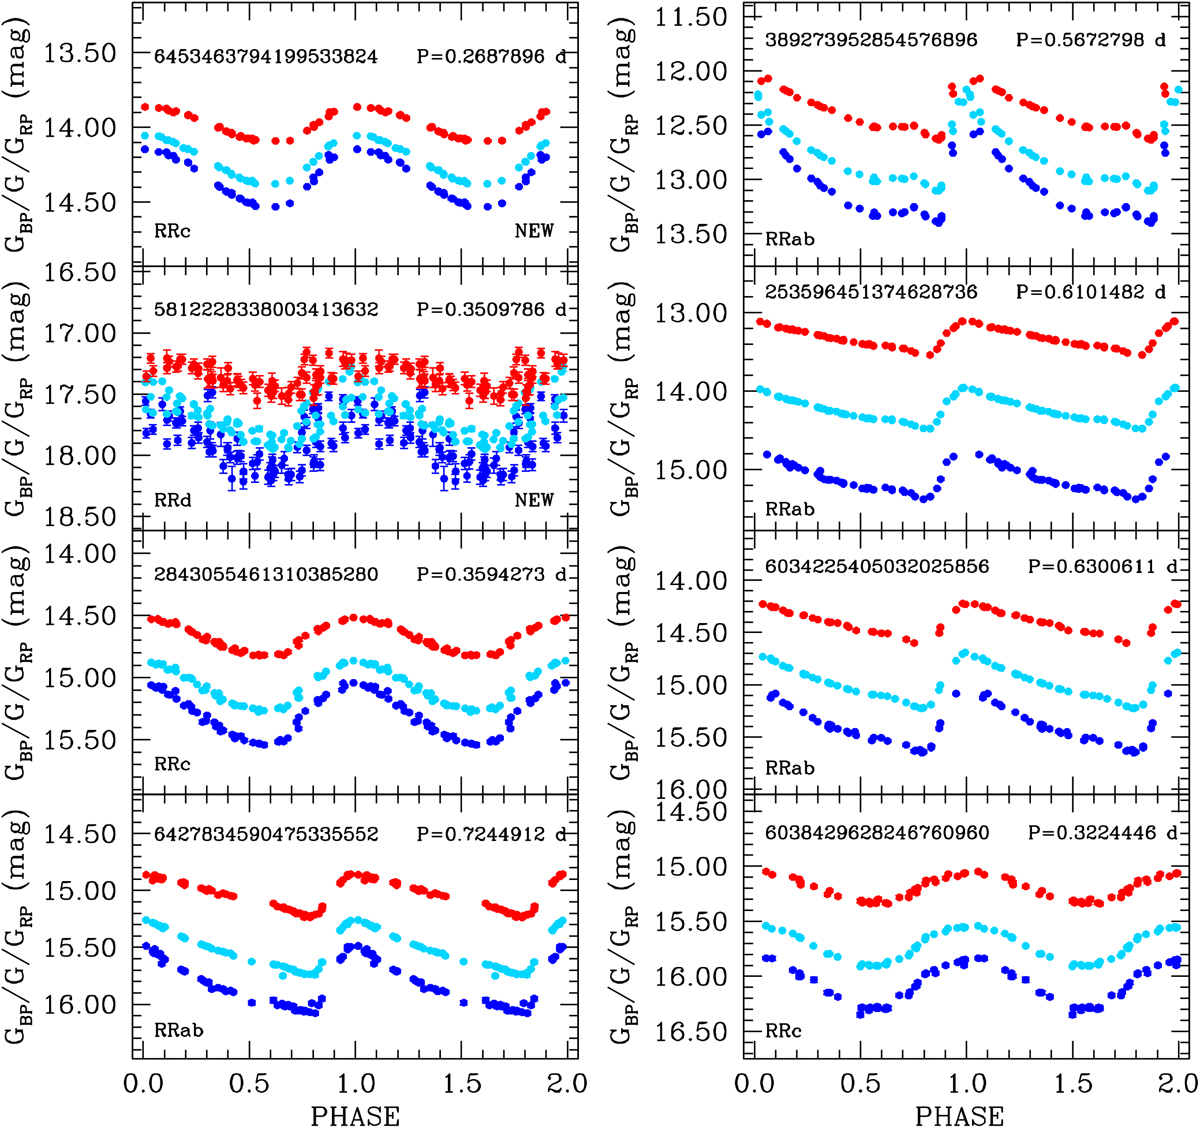
G (cyan), GBP (blue), and GRP (red) light curves of All-Sky RR Lyrae stars of different pulsation mode released in Gaia DR2. The multi-band time-series data are folded according to the period and epoch of maximum light derived by the SOS Cep&RRL pipeline. Error bars are comparable to or smaller than the symbol size. New discoveries by Gaia are flagged.
Current usage metrics show cumulative count of Article Views (full-text article views including HTML views, PDF and ePub downloads, according to the available data) and Abstracts Views on Vision4Press platform.
Data correspond to usage on the plateform after 2015. The current usage metrics is available 48-96 hours after online publication and is updated daily on week days.
Initial download of the metrics may take a while.