Fig. 9.
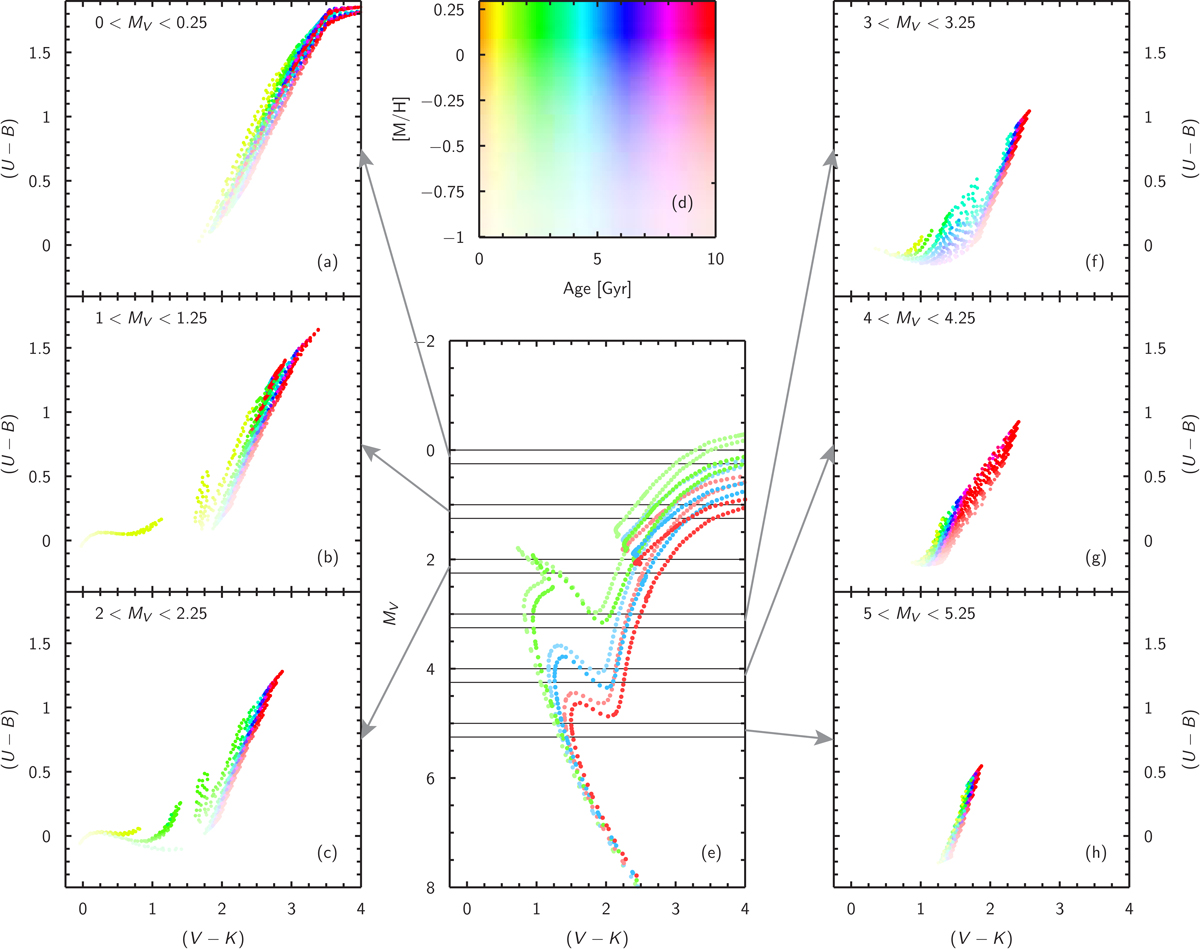
(U − B) vs. (V − K) colour–colour plots for a variety of absolute magnitude ranges. Panels a, b, c, f, g, and h: six colour–colour plots, with data from the isochrone grid. Panel d: colour scheme used in all panels, with different colours representing different ages, and the brightness of the colour representing the metallicity. Panel e: various slices in absolute magnitude used in the outer panels (arrows indicate which slice is shown in which panel), along with six isochrones plotted for demonstration. These isochrones have ages of 2 (green), 5 (blue) and 10 (red) Gyr, and both [Fe/H] = 0.0 (bright) and [Fe/H] = −0.25 (faint).
Current usage metrics show cumulative count of Article Views (full-text article views including HTML views, PDF and ePub downloads, according to the available data) and Abstracts Views on Vision4Press platform.
Data correspond to usage on the plateform after 2015. The current usage metrics is available 48-96 hours after online publication and is updated daily on week days.
Initial download of the metrics may take a while.