Fig. 19.
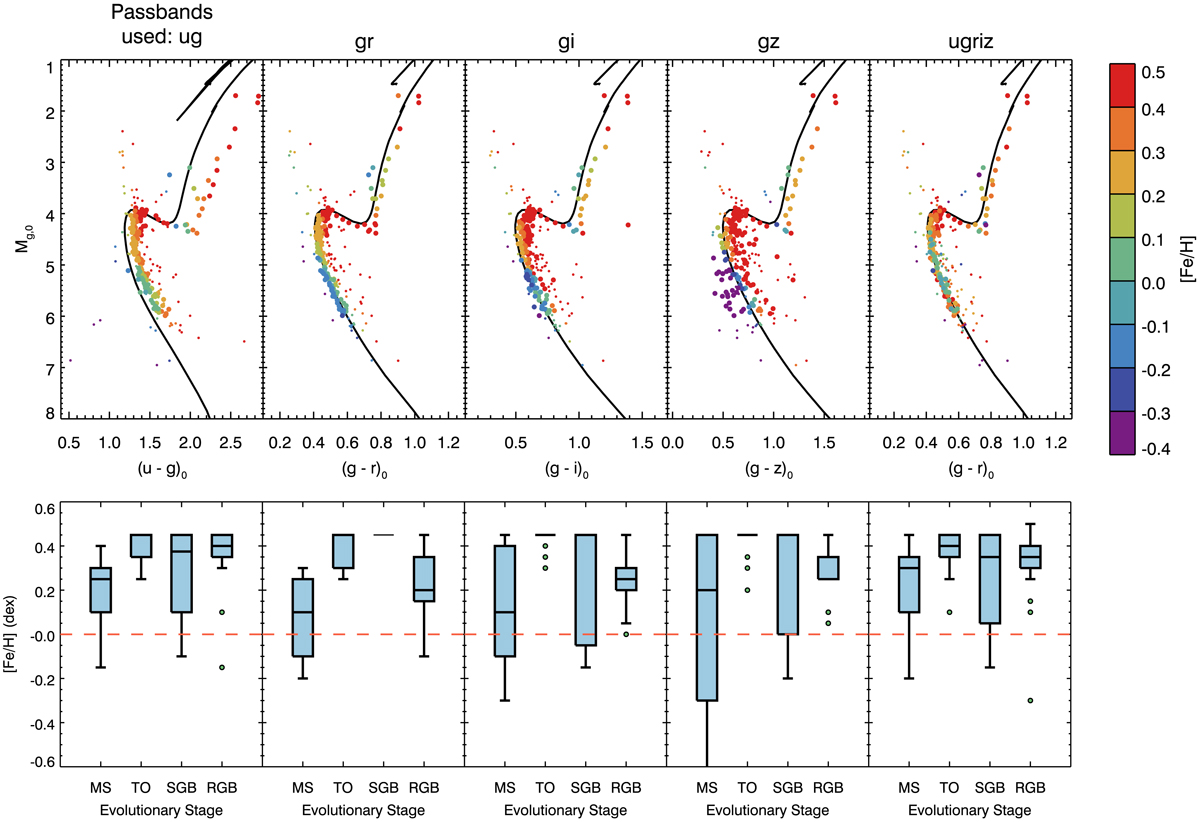
As in Fig. 18 but for [Fe/H] instead of age. Top panels: CMDs of NGC188, where each star is coloured by the most probable [Fe/H] value. Again only the stars shown as large circles are used to create the box and whisker plots below. Bottom panels: box and whisker plots of the most probable [Fe/H] values grouped by evolutionary stage. The whisker of the main sequence stars in the (g − z) plot extends beyond the bottom of the plot to [Fe/H] = −1.0.
Current usage metrics show cumulative count of Article Views (full-text article views including HTML views, PDF and ePub downloads, according to the available data) and Abstracts Views on Vision4Press platform.
Data correspond to usage on the plateform after 2015. The current usage metrics is available 48-96 hours after online publication and is updated daily on week days.
Initial download of the metrics may take a while.