Fig. 18.
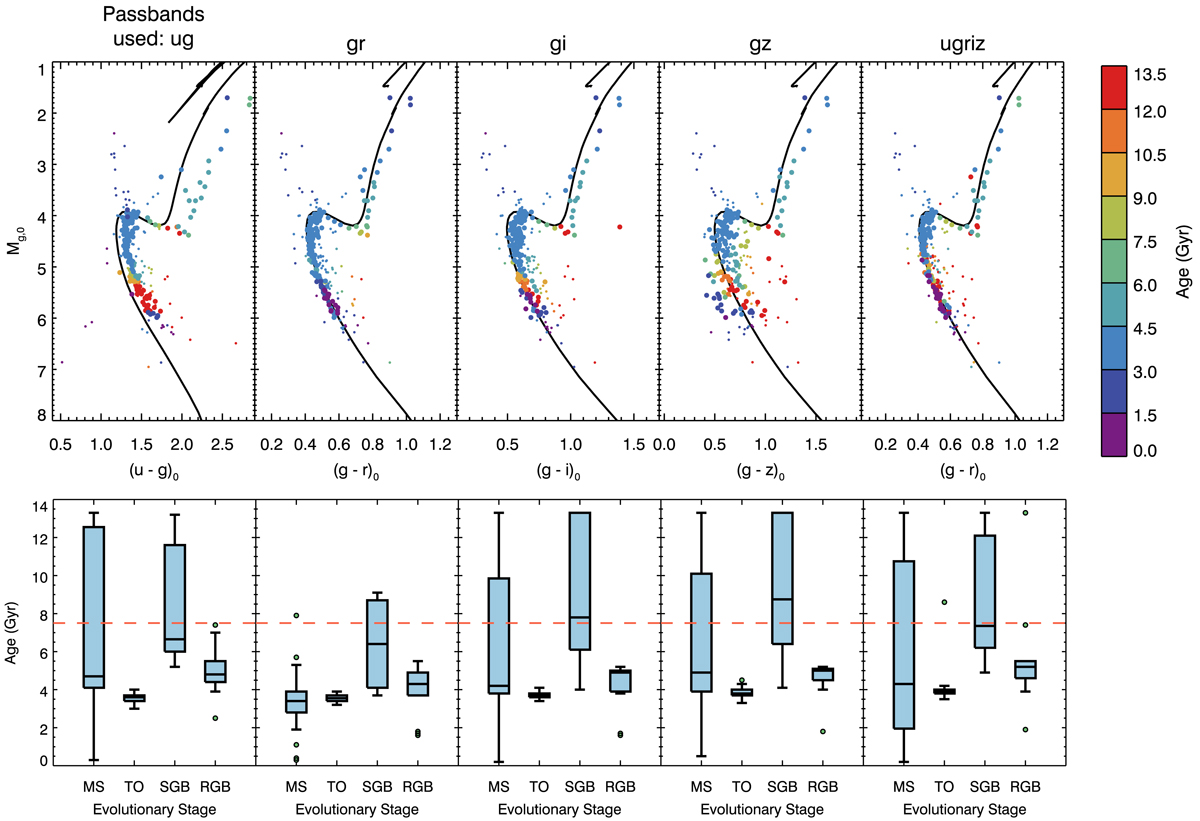
The most probable age calculated for each star, represented first individually, and grouped then by evolutionary type. Top panels: CMDs of NGC188 (as in Fig. 15), where each star is coloured by its most probable age. In each of the five plots, the age is calculated using the colour formed from the passbands printed above the plot. The far right plot uses all four colours ((u − g), (g − r), (g − i), (g − z)), and is shown on the g, (g − r) CMD. Printed for reference is the PARSEC isochrone with the given age (7.5 Gyr) and metallicity (Solar) of the cluster. The larger circles are those selected as belonging to one of the four evolutionary stages and used in the bottom figures, whereas the smaller circles are the remaining probable members not selected for the box and whisker plots. Bottom panels: box and whisker plots of the most probable ages calculated for the stars in NGC188 and grouped by evolutionary stage. The stars used are shown in different colours in Fig. 17, and each 𝒢 function is calculated using the same colours as in the plots above. Outliers are shown as green circles, and the red dashed line shows the “true” age.
Current usage metrics show cumulative count of Article Views (full-text article views including HTML views, PDF and ePub downloads, according to the available data) and Abstracts Views on Vision4Press platform.
Data correspond to usage on the plateform after 2015. The current usage metrics is available 48-96 hours after online publication and is updated daily on week days.
Initial download of the metrics may take a while.