Fig. 17.
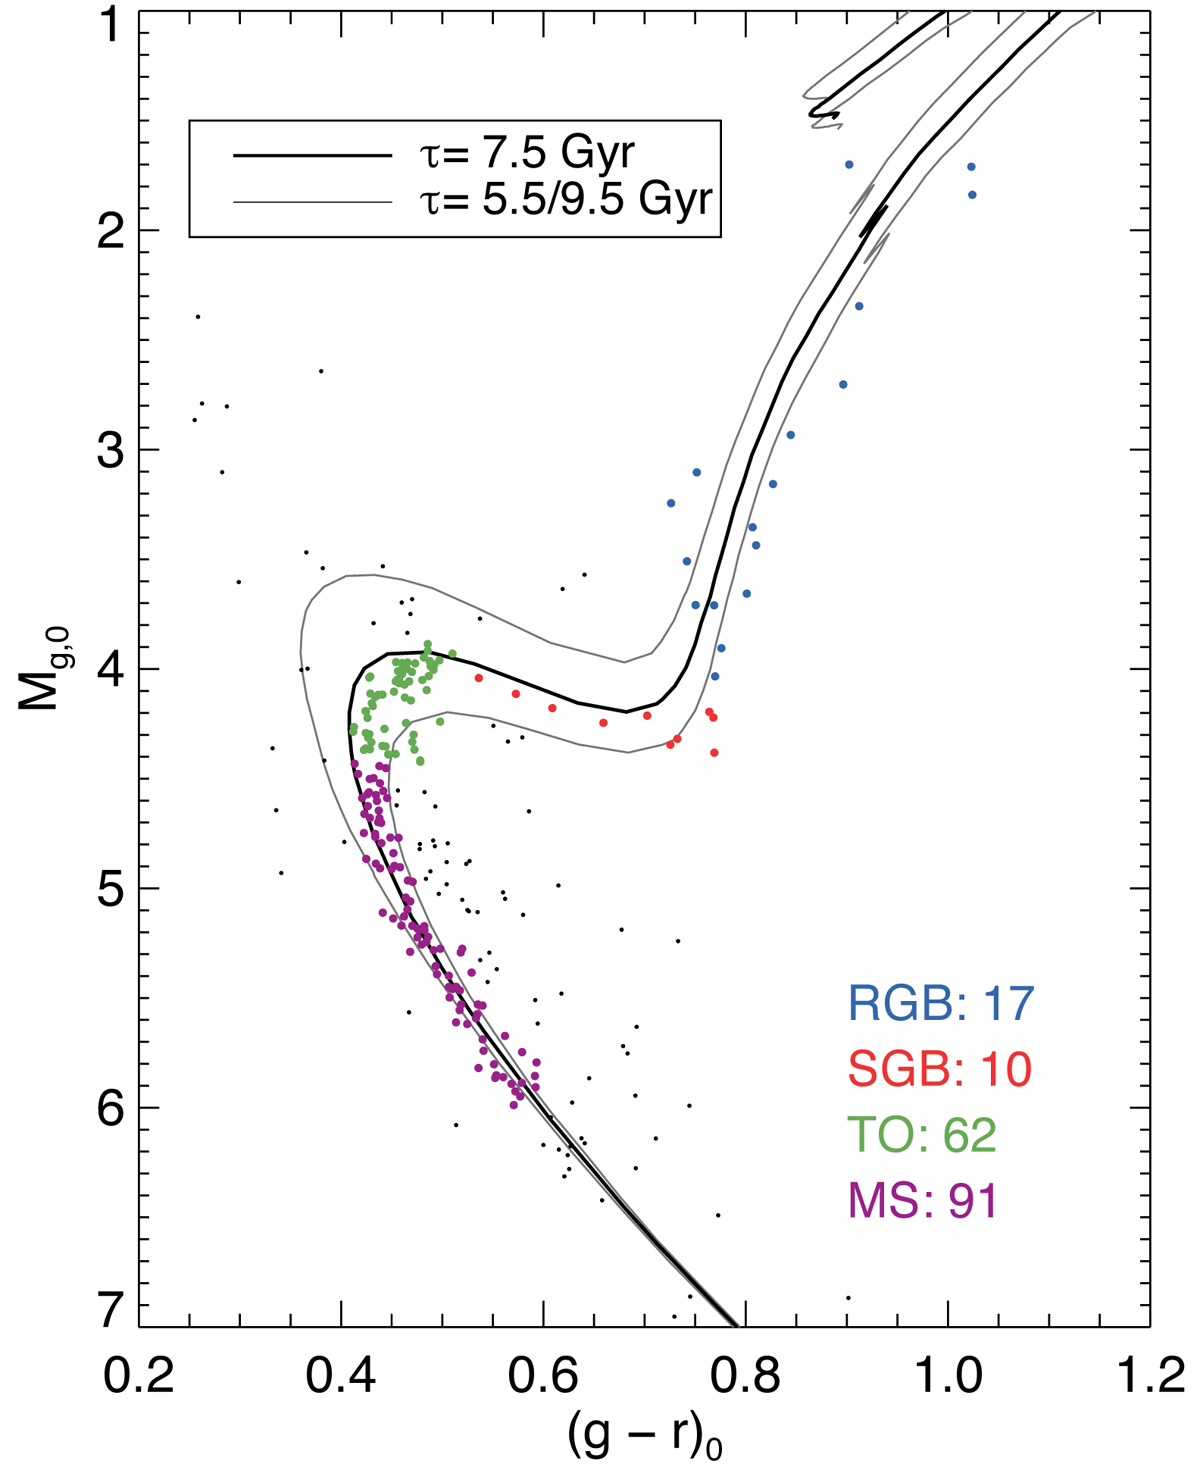
g, (g − r) CMD of NGC188, with stars coloured according to which of the four evolutionary stages they are in for the purposes of the box and whisker plots of Figs. 18 and 19, and the discussion in Sect. 4.2. At the bottom right of the figure are the numbers of stars in each evolutionary stage. The small black dots are those stars which we excluded from further analysis. The isochrones plotted underneath are the same as those in Fig. 15.
Current usage metrics show cumulative count of Article Views (full-text article views including HTML views, PDF and ePub downloads, according to the available data) and Abstracts Views on Vision4Press platform.
Data correspond to usage on the plateform after 2015. The current usage metrics is available 48-96 hours after online publication and is updated daily on week days.
Initial download of the metrics may take a while.