Fig. 10.
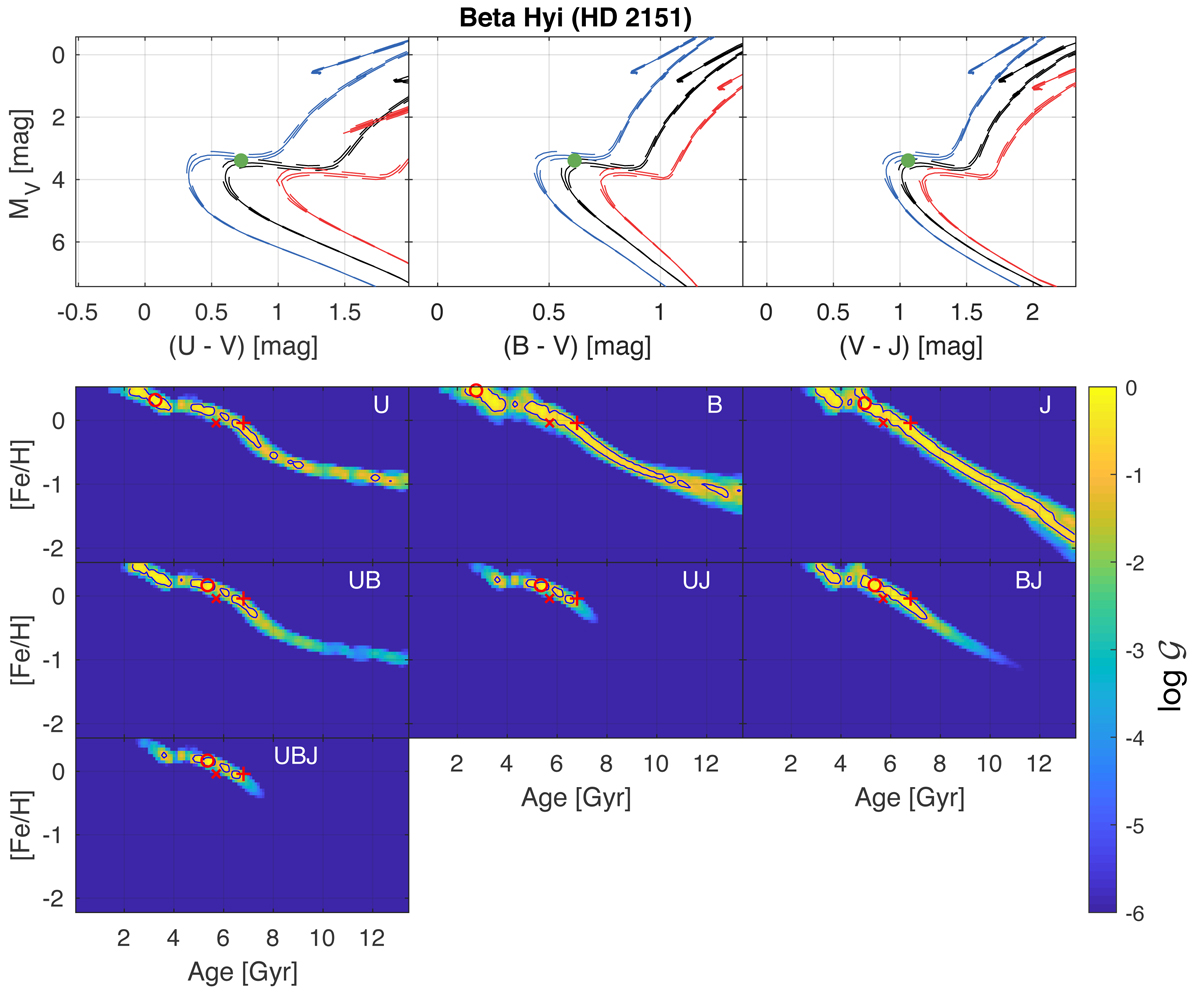
Tests run on the Gaia benchmark star β Hyi. Top panels: CMDs of the three different colours used; (U − V), (B − V), and (V − J). The black isochrone is at the calculated age for the star (given in Table 2), with the other isochrones defined as in Fig. 2. The green point shows the observed photometry. Bottom panels: 𝒢 functions calculated using the parallax, V band magnitude, and the colours created from V and each passband denoted in the top right corner of each subplot. Both the literature age (as a red cross) and the calculated spectroscopic age (as a red plus sign) are shown, taken from Sahlholdt et al. (2018).
Current usage metrics show cumulative count of Article Views (full-text article views including HTML views, PDF and ePub downloads, according to the available data) and Abstracts Views on Vision4Press platform.
Data correspond to usage on the plateform after 2015. The current usage metrics is available 48-96 hours after online publication and is updated daily on week days.
Initial download of the metrics may take a while.