Fig. 1.
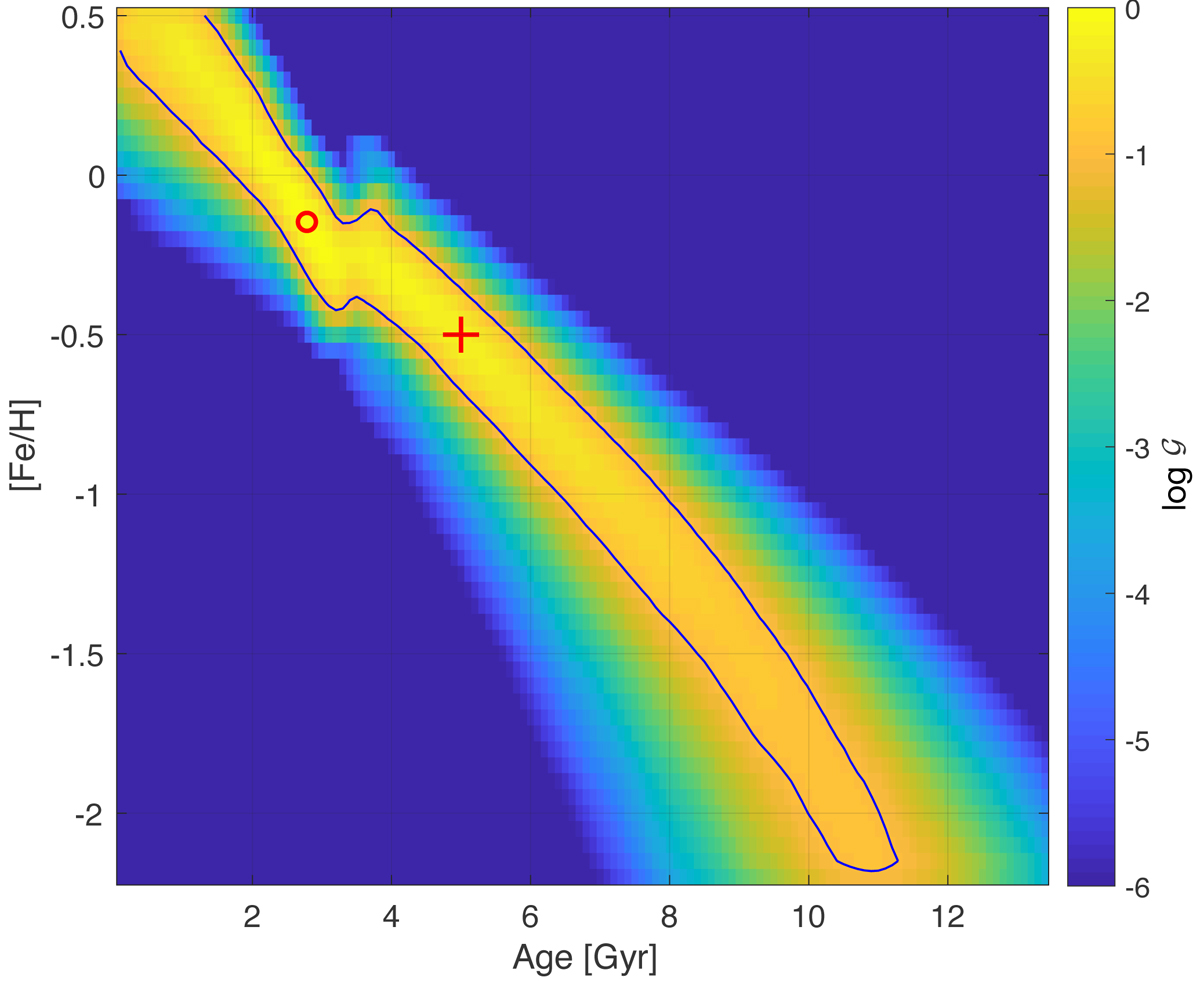
2D age-metallicity probability map, here called a 𝒢 function, calculated for the example star in Sect. 2.3, using the Gaia G band, and the colours (G − GBP) and (G − GRP). The colour bar shows the log of the marginalised likelihood, normalised to 1 at its highest point, with the 90% confidence interval highlighted with a solid dark line. The red circle represents the point of highest probability, and the red cross represents the star’s true [Fe/H] and age.
Current usage metrics show cumulative count of Article Views (full-text article views including HTML views, PDF and ePub downloads, according to the available data) and Abstracts Views on Vision4Press platform.
Data correspond to usage on the plateform after 2015. The current usage metrics is available 48-96 hours after online publication and is updated daily on week days.
Initial download of the metrics may take a while.