Fig. 9
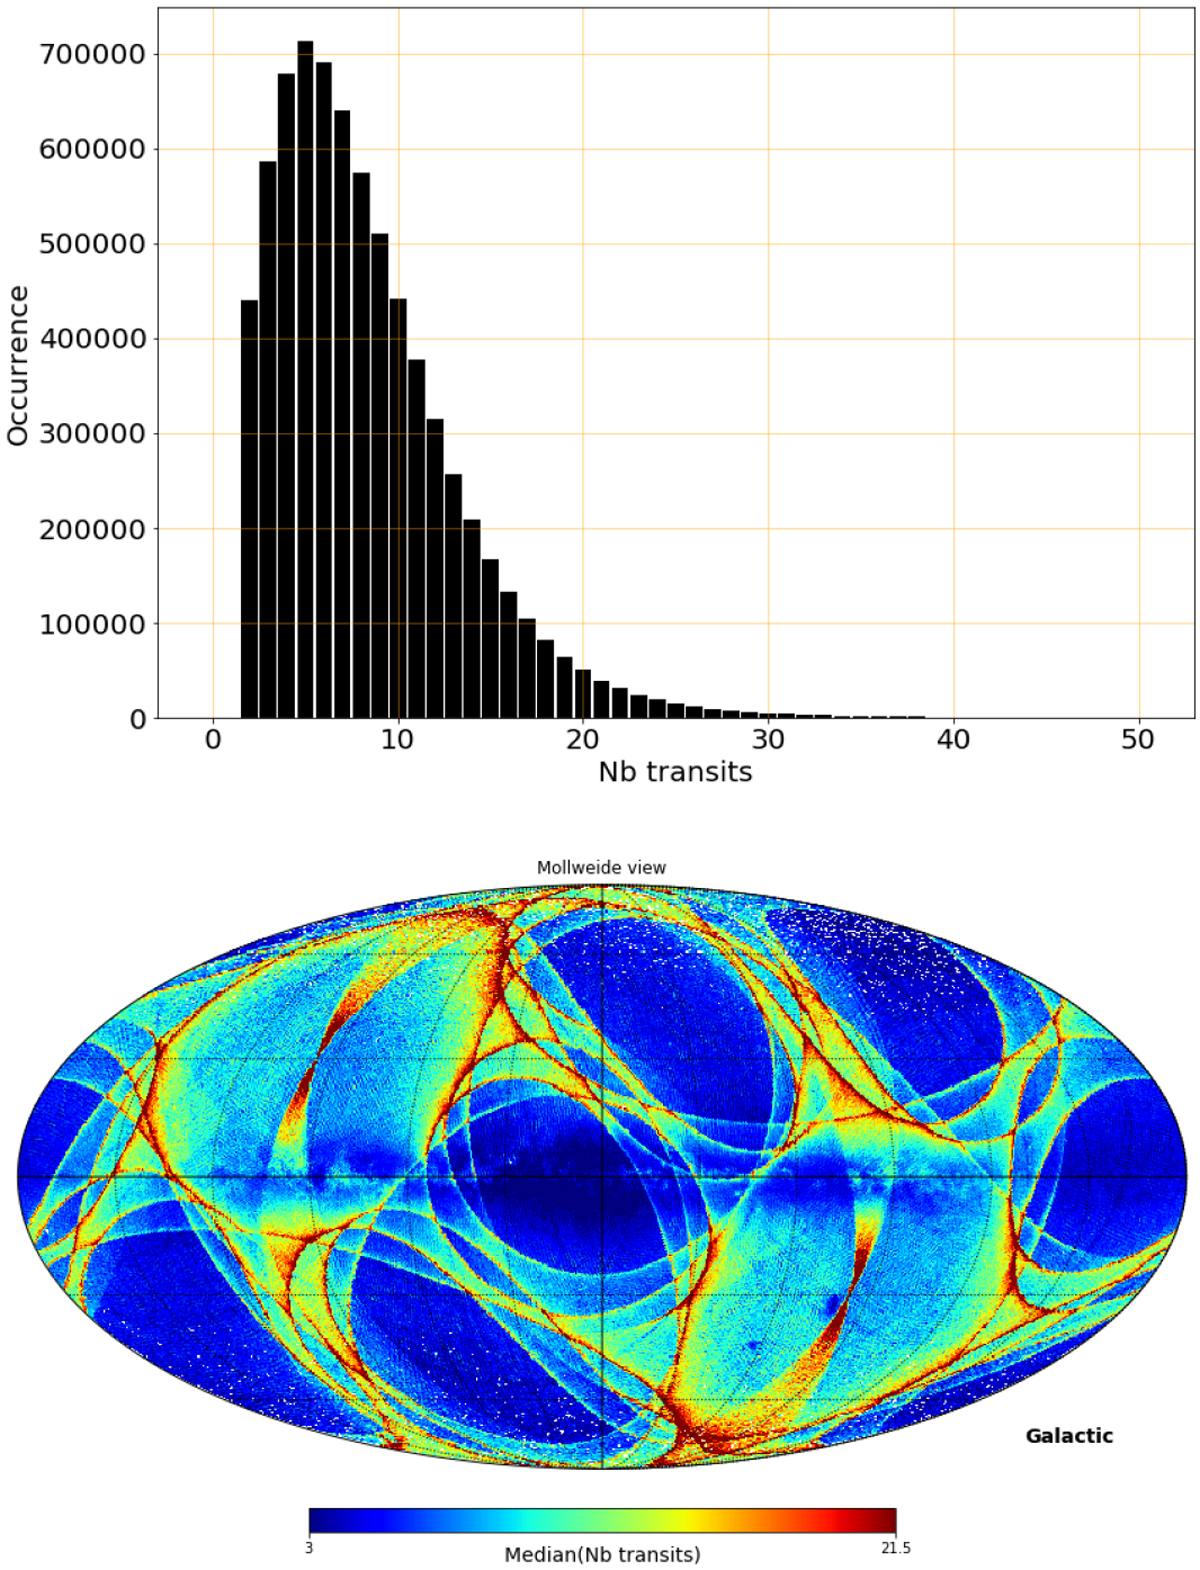
Top panel: distribution of the number of transits per star used to derive the median radial velocity. The full distribution extends to 201 transits. The 1053 stars (0.015% of the total) with more than 50 transits are not shown in the histogram. Bottom panel: distribution of the median number of transits as a function of galactic coordinates. The Galactic Centre is in the middle of the figure and the galactic longitudes increase to the left. The pixel size is about 0.2 square degree (healpix level 7).
Current usage metrics show cumulative count of Article Views (full-text article views including HTML views, PDF and ePub downloads, according to the available data) and Abstracts Views on Vision4Press platform.
Data correspond to usage on the plateform after 2015. The current usage metrics is available 48-96 hours after online publication and is updated daily on week days.
Initial download of the metrics may take a while.