Fig. 19
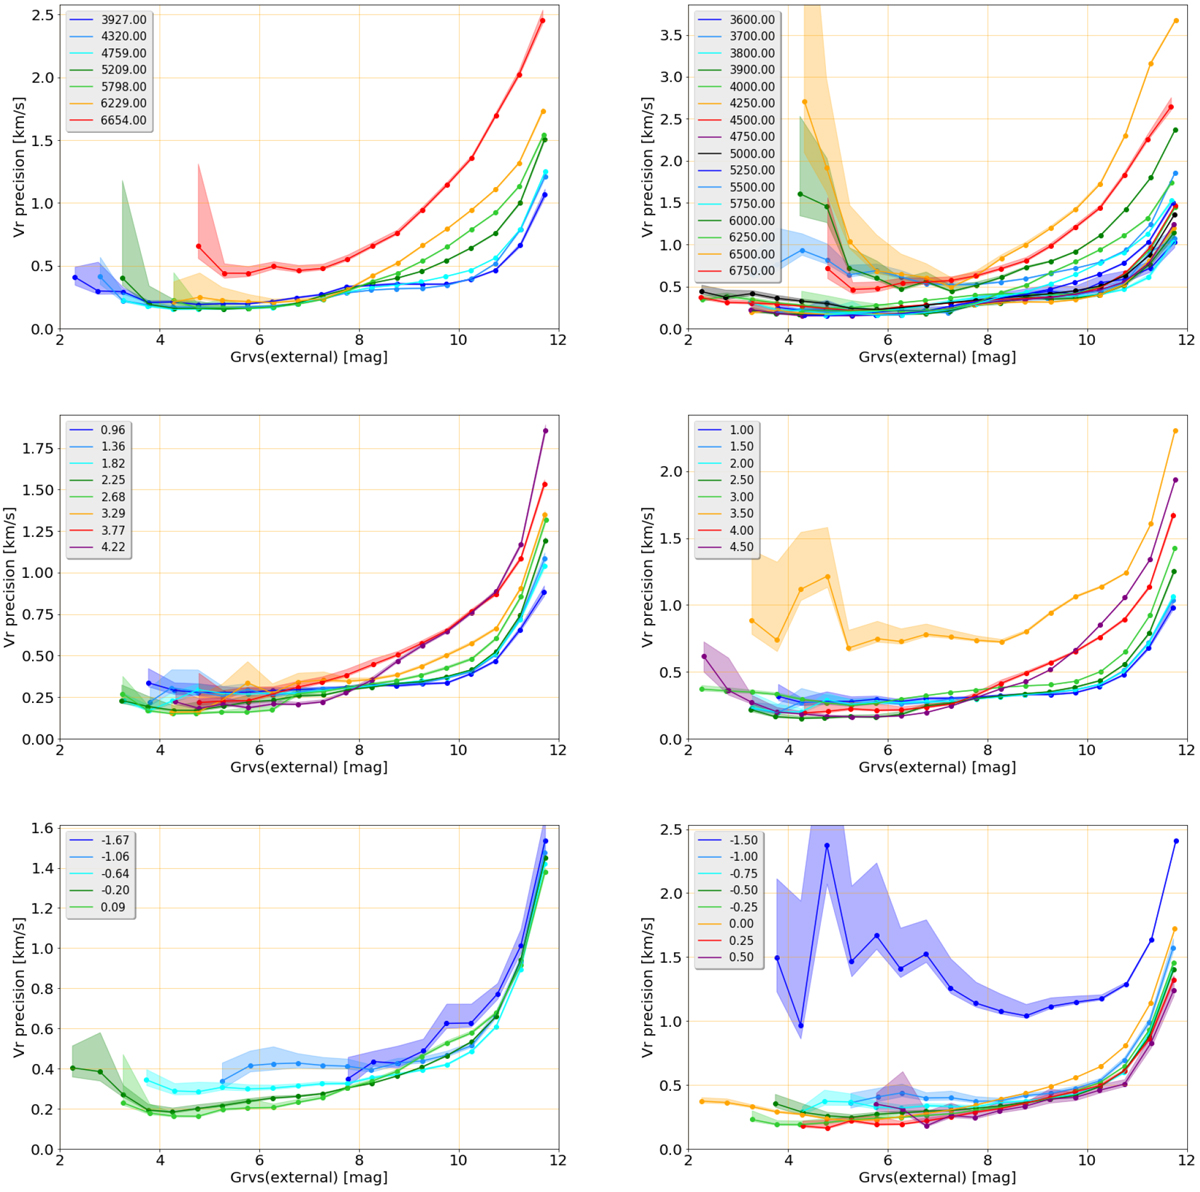
Top left panel: radial velocity precision as a function of ![]() magnitude and effective temperature. Each curve corresponds to an interval of 500 K: for instance, [3500, 4000] K (dark blue), [4000, 4500] K (blue). The mean effective temperature of each interval is given in the legend. Top right panel: radial velocity precision as a function of
magnitude and effective temperature. Each curve corresponds to an interval of 500 K: for instance, [3500, 4000] K (dark blue), [4000, 4500] K (blue). The mean effective temperature of each interval is given in the legend. Top right panel: radial velocity precision as a function of ![]() magnitude and template effective temperature. Each curve corresponds to the effective temperature of a node in the grid of templates used by the spectroscopic pipeline to derive the radial velocities. The effective temperatures of the nodes are given in the legend. Middle left panel: radial velocity precision as a function of
magnitude and template effective temperature. Each curve corresponds to the effective temperature of a node in the grid of templates used by the spectroscopic pipeline to derive the radial velocities. The effective temperatures of the nodes are given in the legend. Middle left panel: radial velocity precision as a function of ![]() magnitude and surface gravity. Each curve corresponds to an interval of 0.5 in surface gravity: for instance, [0.5, 1.0] (dark blue), [1.0, 1.5] (blue). The mean surface gravity of each interval is given in the legend. Middle right panel: radial velocity precision as a function of
magnitude and surface gravity. Each curve corresponds to an interval of 0.5 in surface gravity: for instance, [0.5, 1.0] (dark blue), [1.0, 1.5] (blue). The mean surface gravity of each interval is given in the legend. Middle right panel: radial velocity precision as a function of ![]() magnitude and template surface gravity. Each curve corresponds to the surface gravity of a node in the grid of templates used by the spectroscopic pipeline to derive the radial velocities. The surface gravities of the nodes are given in the legend. Bottom left panel: radial velocity precision as a function of
magnitude and template surface gravity. Each curve corresponds to the surface gravity of a node in the grid of templates used by the spectroscopic pipeline to derive the radial velocities. The surface gravities of the nodes are given in the legend. Bottom left panel: radial velocity precision as a function of ![]() magnitude and metallicity. Each curve corresponds to an interval of 0.5 dex: for instance, [−2.0, −1.5] dex (dark blue), [−1.5, −1.0] dex (blue). The mean metallicity of each interval is given in the legend. Bottom right panel: radial velocity precision as a function of
magnitude and metallicity. Each curve corresponds to an interval of 0.5 dex: for instance, [−2.0, −1.5] dex (dark blue), [−1.5, −1.0] dex (blue). The mean metallicity of each interval is given in the legend. Bottom right panel: radial velocity precision as a function of ![]() magnitude and template metallicity. Each curve corresponds to the metallicity of a node in the grid of templates used by the spectroscopic pipeline to derive the radial velocities. The metallicities of the nodes are given in the legend. The lower and upper 1σ uncertainties on the measures of the precision are represented as shaded areas.
magnitude and template metallicity. Each curve corresponds to the metallicity of a node in the grid of templates used by the spectroscopic pipeline to derive the radial velocities. The metallicities of the nodes are given in the legend. The lower and upper 1σ uncertainties on the measures of the precision are represented as shaded areas.
Current usage metrics show cumulative count of Article Views (full-text article views including HTML views, PDF and ePub downloads, according to the available data) and Abstracts Views on Vision4Press platform.
Data correspond to usage on the plateform after 2015. The current usage metrics is available 48-96 hours after online publication and is updated daily on week days.
Initial download of the metrics may take a while.