Free Access
Fig. 11.
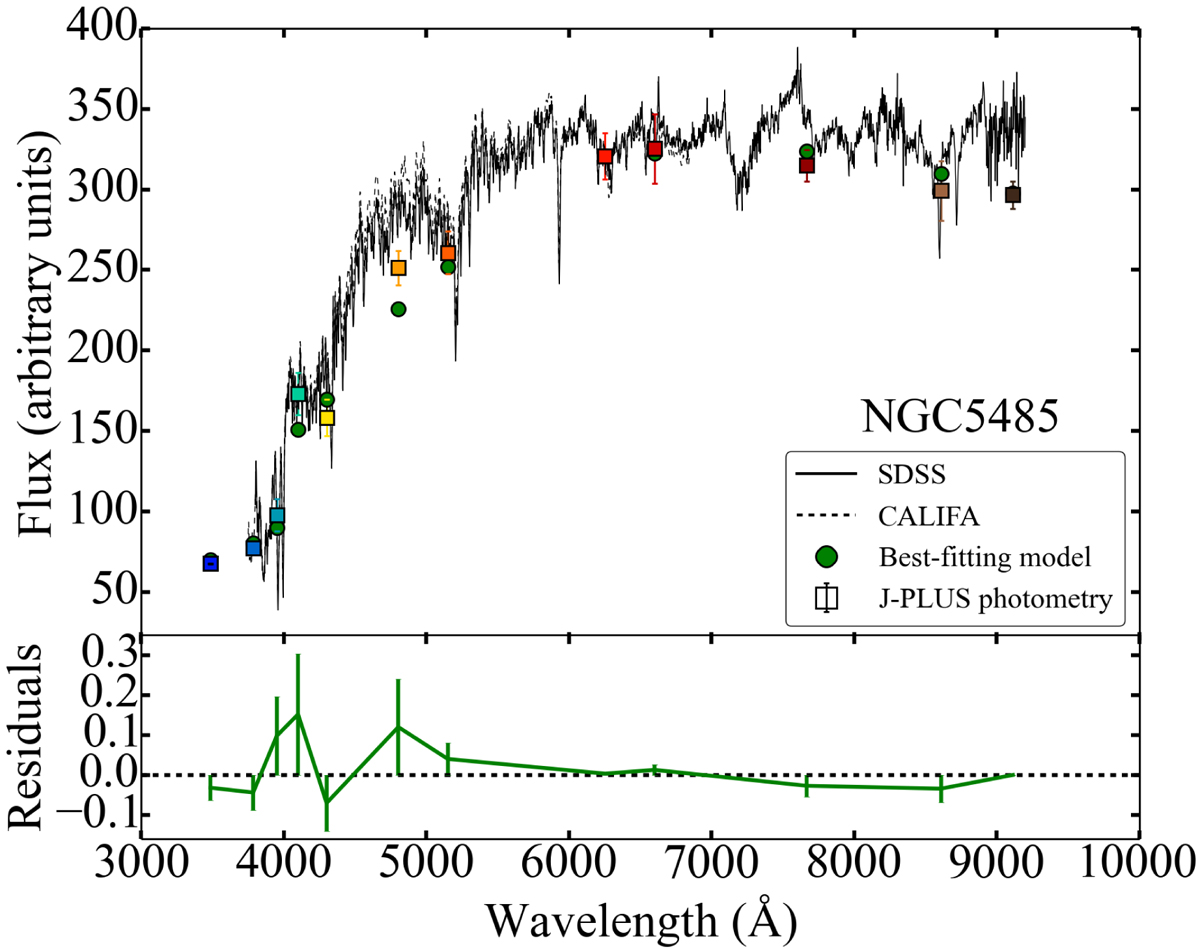
Comparison between the integrated spectra in a 3″ diameter fiber of SDSS, CALIFA, and the photo-spectrum of J-PLUS for NGC 5485. Error bars correspond to the photometric errors. The best-fitting model to the photo-spectrum of J-PLUS is plotted as green circles. Bottom panel: residuals of the best-fitting model.
Current usage metrics show cumulative count of Article Views (full-text article views including HTML views, PDF and ePub downloads, according to the available data) and Abstracts Views on Vision4Press platform.
Data correspond to usage on the plateform after 2015. The current usage metrics is available 48-96 hours after online publication and is updated daily on week days.
Initial download of the metrics may take a while.