Fig. 6.
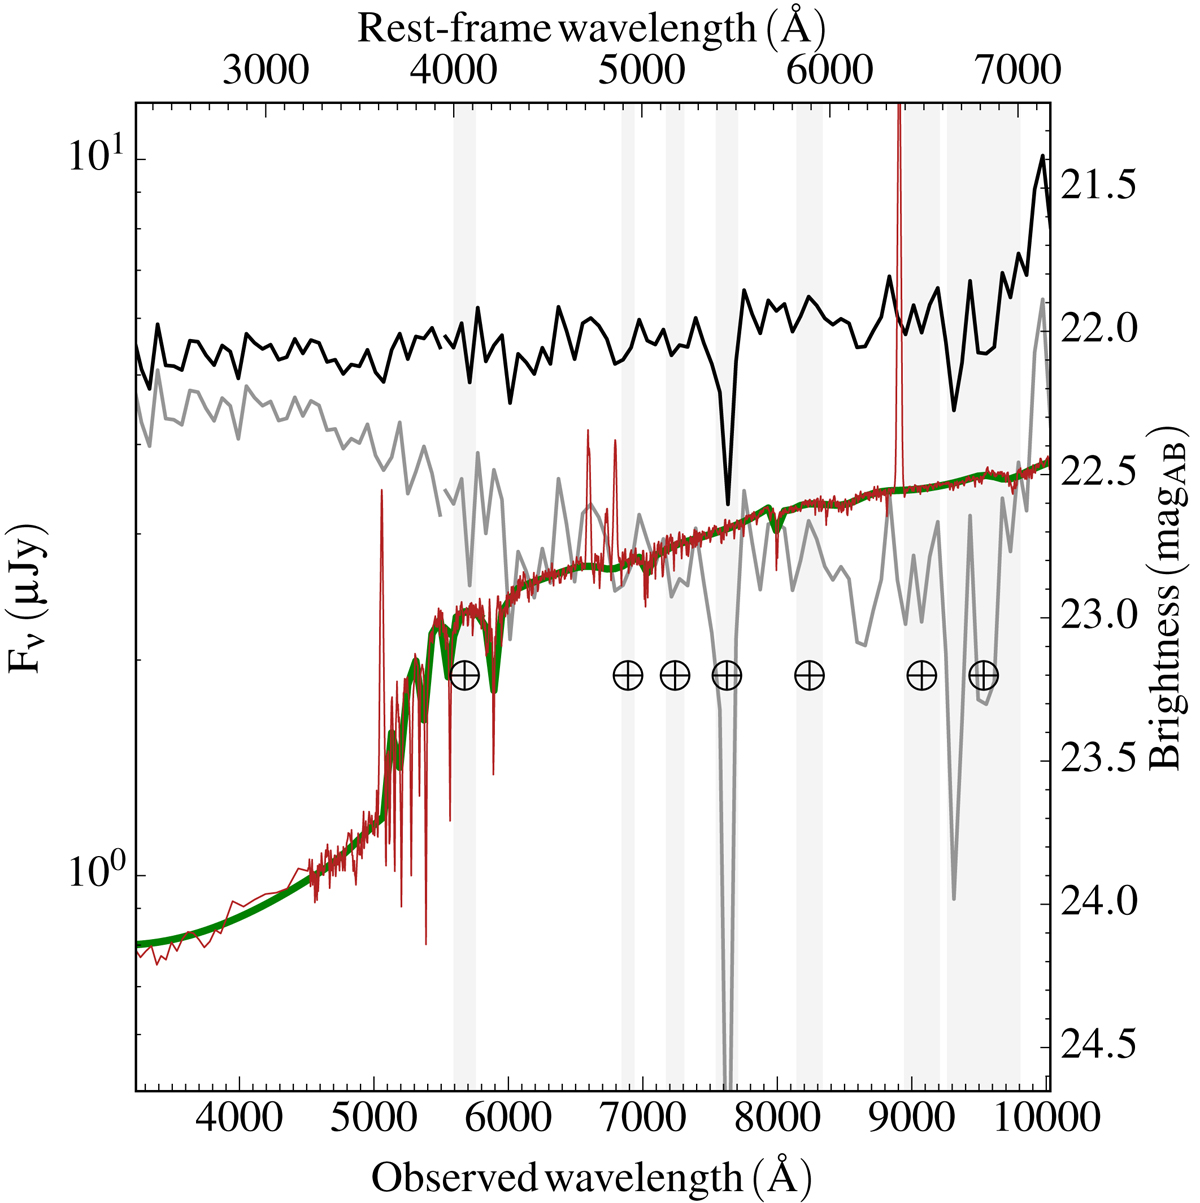
VLT/X-shooter spectrum of the optical transient that followed GRB 120714B, taken at tobs = 0.353 days after the burst. The binned original spectrum is shown in black, the host-galaxy SED template as obtained from the Le PHARE fit (Appendix A.3) in red. The green curve shows the smoothed host-galaxy template that was subtracted from the original spectrum. The host-subtracted SED is drawn in light gray. Flux densities refer to the observer frame. Telluric features are indicated.
Current usage metrics show cumulative count of Article Views (full-text article views including HTML views, PDF and ePub downloads, according to the available data) and Abstracts Views on Vision4Press platform.
Data correspond to usage on the plateform after 2015. The current usage metrics is available 48-96 hours after online publication and is updated daily on week days.
Initial download of the metrics may take a while.