Fig. 11.
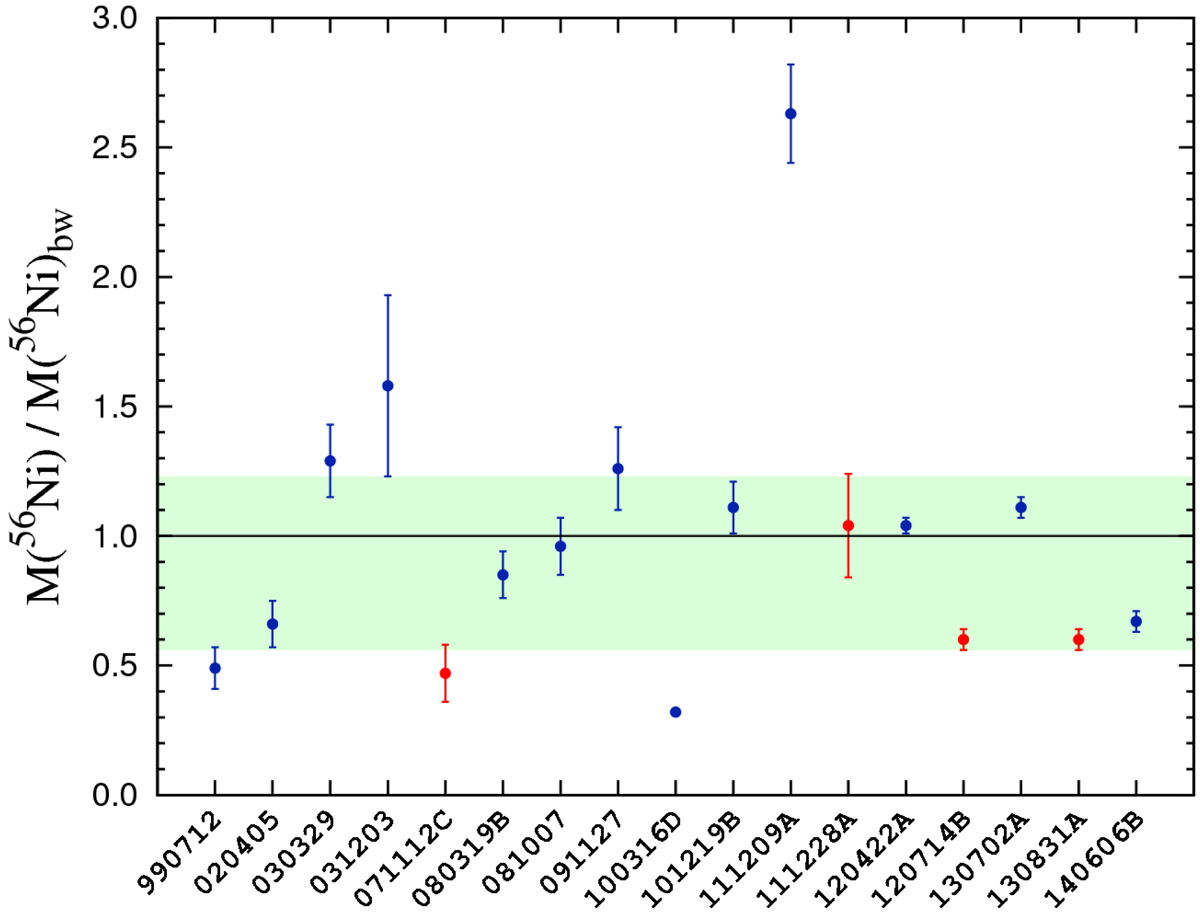
Ejected mass of 56Ni for the 17 GRB SNe listed in Table 2 according to the Stritzinger–Leibundgut relation. In red are shown the results for the four GRB SNe discussed here. Excluding the apparent outlier GRB 111209A, the vast majority (15 SNe) of the remaining 16 SNe lie in the colored region (within their 1σ errors). The black horizontal line highlights the position of the template SN 1998bw.
Current usage metrics show cumulative count of Article Views (full-text article views including HTML views, PDF and ePub downloads, according to the available data) and Abstracts Views on Vision4Press platform.
Data correspond to usage on the plateform after 2015. The current usage metrics is available 48-96 hours after online publication and is updated daily on week days.
Initial download of the metrics may take a while.