Fig. 7.
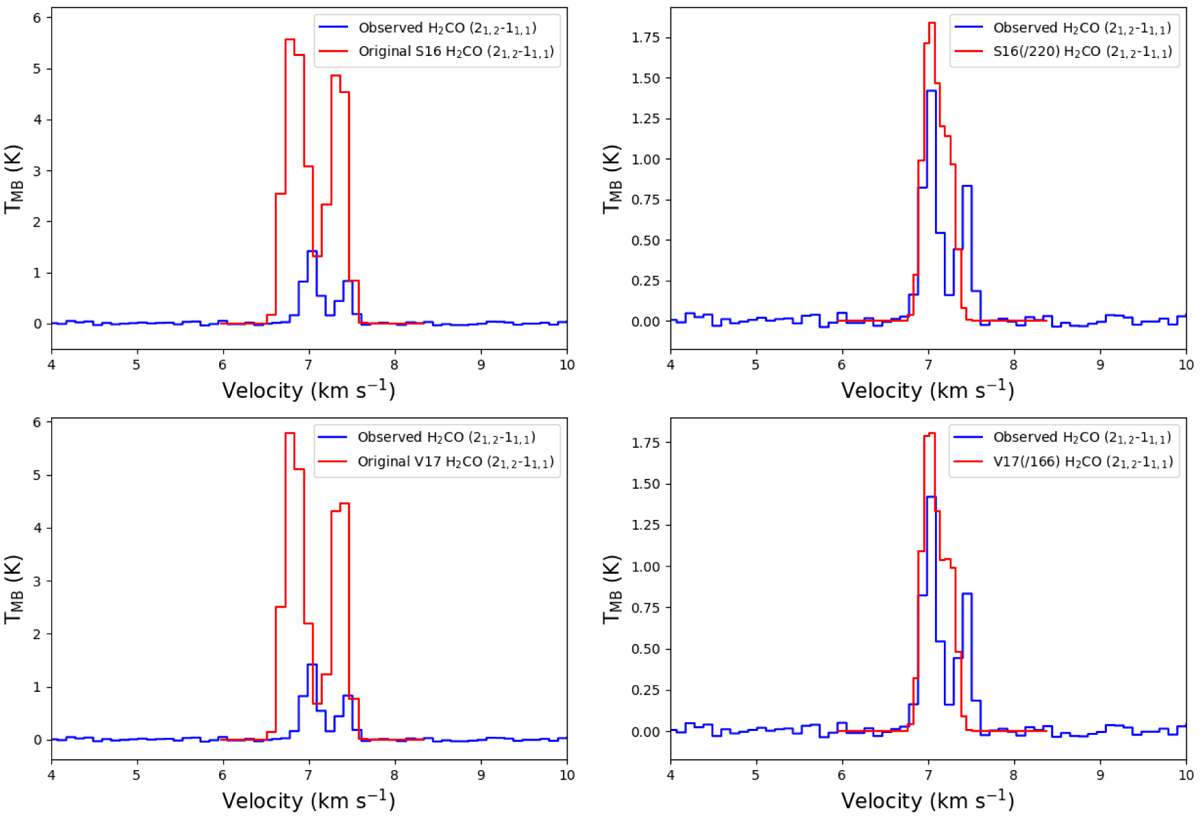
Comparison of the emission modeled by MOLLIE (in red, see Sect. 5.1) and the observed emission (in blue) of the H2CO transition observed at the center of the core. Top panels: results using S16 abundance profile (left panel), and the same scaled by a factor of 220 (right panel). Bottom panels: results using V17 abundance profile (left panel), and the same scaled by a factor of 166 (right panel). The original abundance profiles overestimate the emission of the line by a factor of ~3, and the scaled abundance profiles do not reproduce the shape of the line.
Current usage metrics show cumulative count of Article Views (full-text article views including HTML views, PDF and ePub downloads, according to the available data) and Abstracts Views on Vision4Press platform.
Data correspond to usage on the plateform after 2015. The current usage metrics is available 48-96 hours after online publication and is updated daily on week days.
Initial download of the metrics may take a while.