Fig. 3.
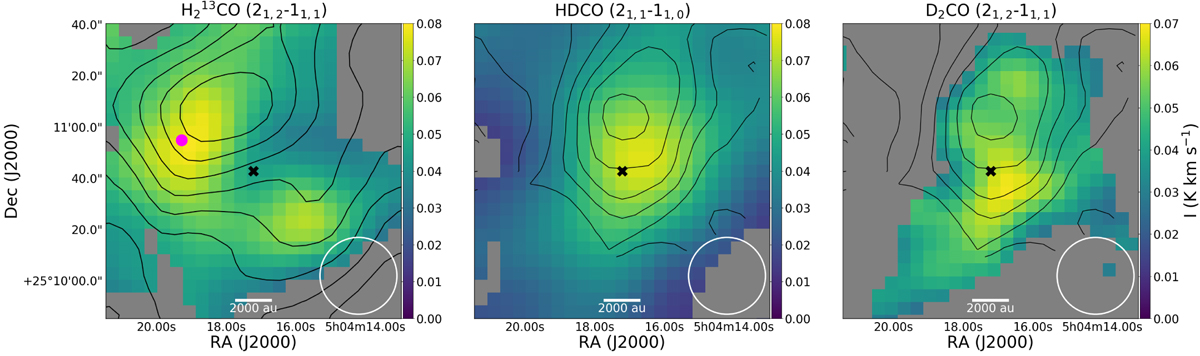
Left panel: integrated intensity map of H![]() CO (22,1 –11,1). The error on the integrated intensity is 0.01 K km s−1. The black contours represent increasing 10% steps of the CH3OH column density map, derived as explained in Sect. 4.1. The pink circle marks the C17O peak (see also Fig. 4). Middle panel: integrated intensity maps of HDCO (21,1 –11,0). The error on the integrated intensity is 0.005 K km s−1. The black contours represent 10% steps with respect to the deuterated methanol column density peak. Right panel: integrated intensity map of D2CO (21,2 –11,1). The error on the integrated intensity is 0.01 K km s−1. The black contours represent 10% steps with respect to the deuterated methanol column density peak. In all panels, the beam is shown in the bottom right corners, and the black cross marks the dust continuum peak. Only pixels with detection levels above 3σ are included.
CO (22,1 –11,1). The error on the integrated intensity is 0.01 K km s−1. The black contours represent increasing 10% steps of the CH3OH column density map, derived as explained in Sect. 4.1. The pink circle marks the C17O peak (see also Fig. 4). Middle panel: integrated intensity maps of HDCO (21,1 –11,0). The error on the integrated intensity is 0.005 K km s−1. The black contours represent 10% steps with respect to the deuterated methanol column density peak. Right panel: integrated intensity map of D2CO (21,2 –11,1). The error on the integrated intensity is 0.01 K km s−1. The black contours represent 10% steps with respect to the deuterated methanol column density peak. In all panels, the beam is shown in the bottom right corners, and the black cross marks the dust continuum peak. Only pixels with detection levels above 3σ are included.
Current usage metrics show cumulative count of Article Views (full-text article views including HTML views, PDF and ePub downloads, according to the available data) and Abstracts Views on Vision4Press platform.
Data correspond to usage on the plateform after 2015. The current usage metrics is available 48-96 hours after online publication and is updated daily on week days.
Initial download of the metrics may take a while.