Fig. B.1.
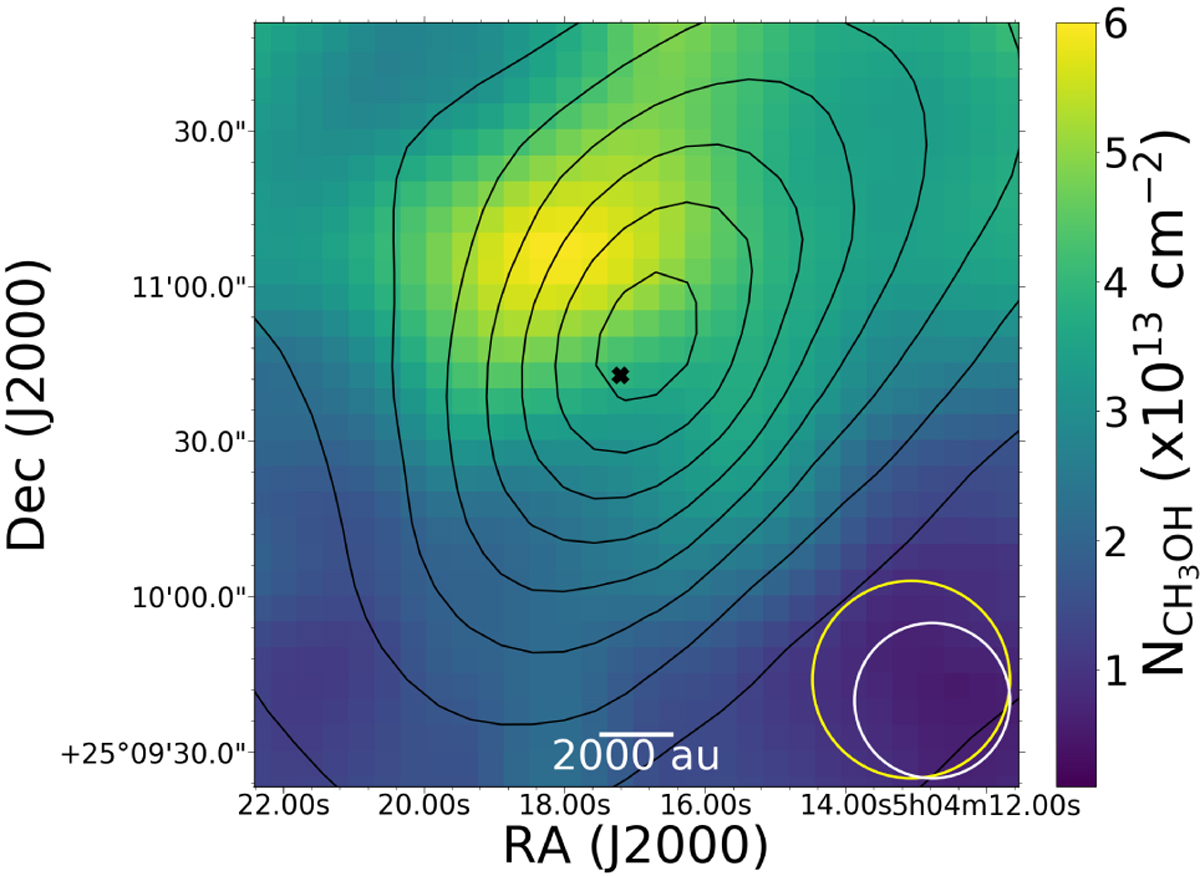
Column density map of CH3OH derived as explained in Sect. 4.1. The black contours represent increasing 10% steps of the N![]() column density map, derived by Spezzano et al. (2016). The beams are shown in the bottom right corner of the figure, in yellow for Herschel/SPIRE and in white for the 30 m telescope. The black cross marks the dust continuum peak.
column density map, derived by Spezzano et al. (2016). The beams are shown in the bottom right corner of the figure, in yellow for Herschel/SPIRE and in white for the 30 m telescope. The black cross marks the dust continuum peak.
Current usage metrics show cumulative count of Article Views (full-text article views including HTML views, PDF and ePub downloads, according to the available data) and Abstracts Views on Vision4Press platform.
Data correspond to usage on the plateform after 2015. The current usage metrics is available 48-96 hours after online publication and is updated daily on week days.
Initial download of the metrics may take a while.