Fig. 10.
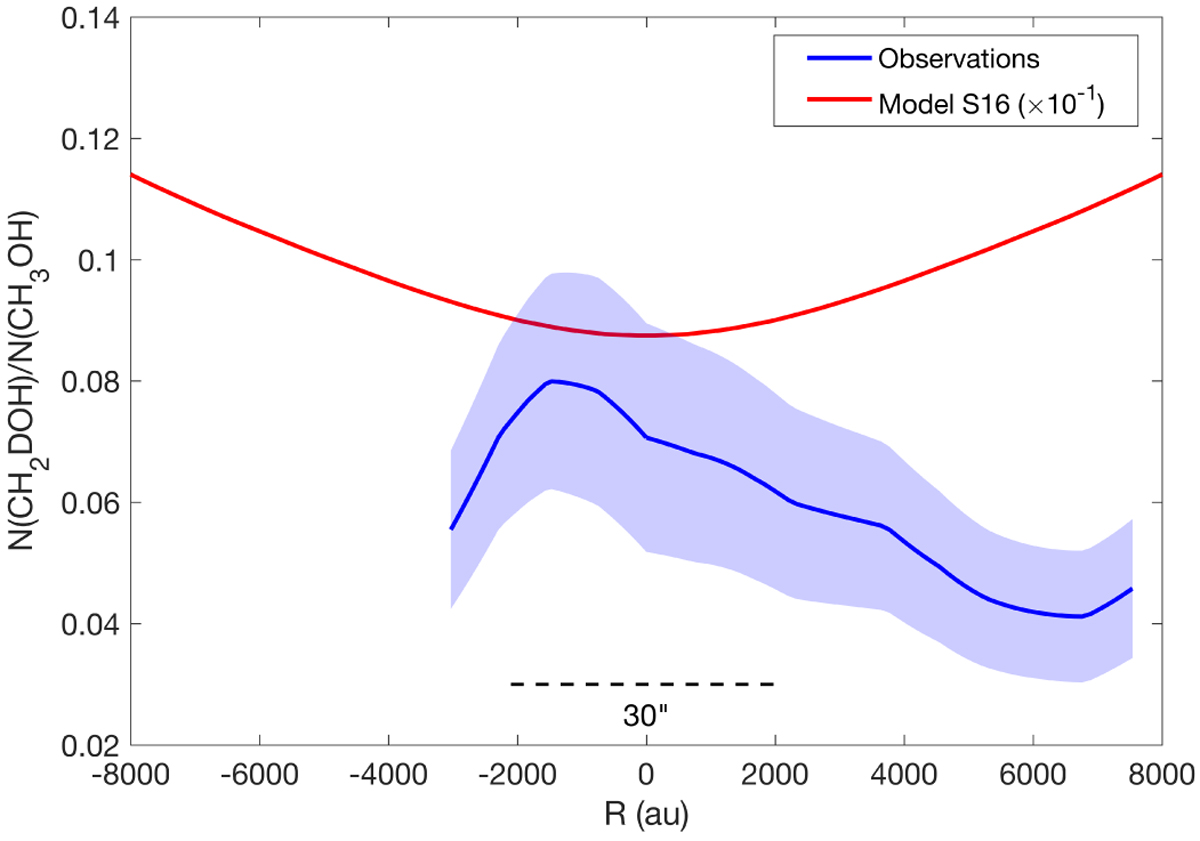
Comparison of the observed methanol deuterium fraction (blue line) with the modeled deuterium fraction by S16 (red line). The observed deuteration profile is taken along the white dashed line in Fig. 2, being R = 0 au the dust peak, R > 0 au the direction from dust peak to methanol peak, and R < 0 au the direction from the dust peak toward the southwest. The shaded blue region shows the error bars in the deuterium fractions. The resolution is 30′′, shown at the bottom of the figure. A scaling factor has been applied to the model.
Current usage metrics show cumulative count of Article Views (full-text article views including HTML views, PDF and ePub downloads, according to the available data) and Abstracts Views on Vision4Press platform.
Data correspond to usage on the plateform after 2015. The current usage metrics is available 48-96 hours after online publication and is updated daily on week days.
Initial download of the metrics may take a while.