Fig. 9
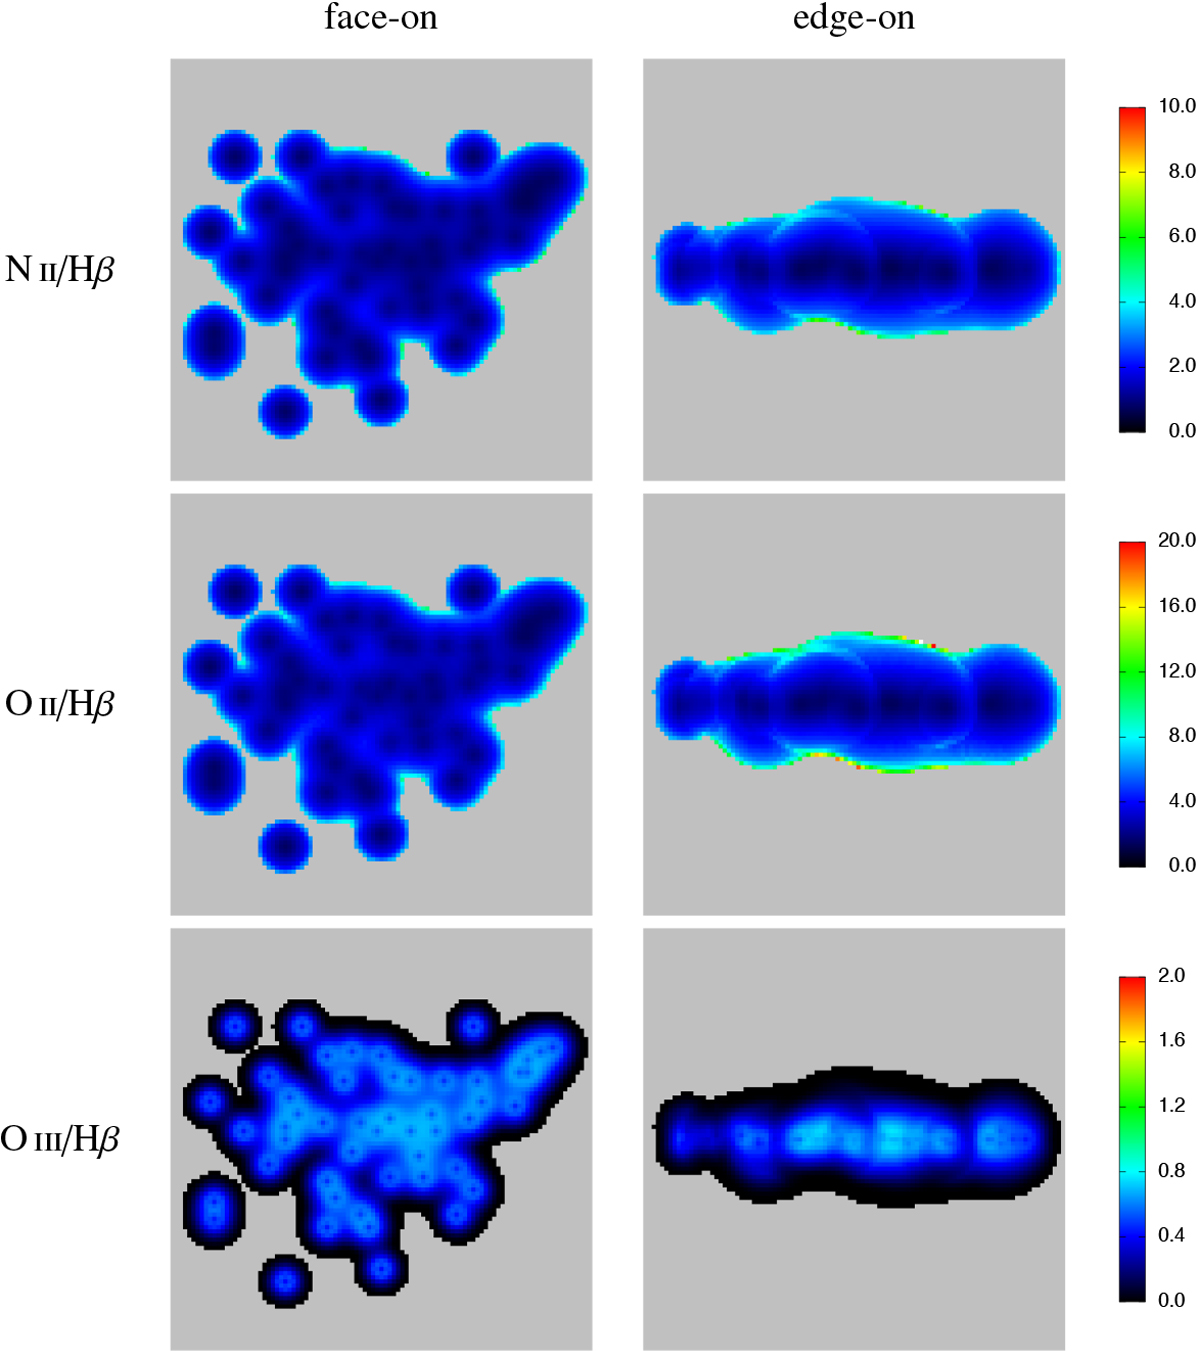
Line ratio maps from microclumped models (fcl = 5) as in the leftmost columns of Figs. 7 and 8, using the same simulation volume and the same integrated hydrogen-ionizing flux as before, but taking the unfiltered spectrum of a 35 kK dwarf star with solar metallicity as the ionizing SED. The most notable difference to the models using the population SED is the weaker emission of the optical [O III] lines. The emission of the [N II] and [O II] lines is stronger close to the galactic plane, but shows a weaker rise close to the edge of the simulated volume.
Current usage metrics show cumulative count of Article Views (full-text article views including HTML views, PDF and ePub downloads, according to the available data) and Abstracts Views on Vision4Press platform.
Data correspond to usage on the plateform after 2015. The current usage metrics is available 48-96 hours after online publication and is updated daily on week days.
Initial download of the metrics may take a while.