Fig. 6
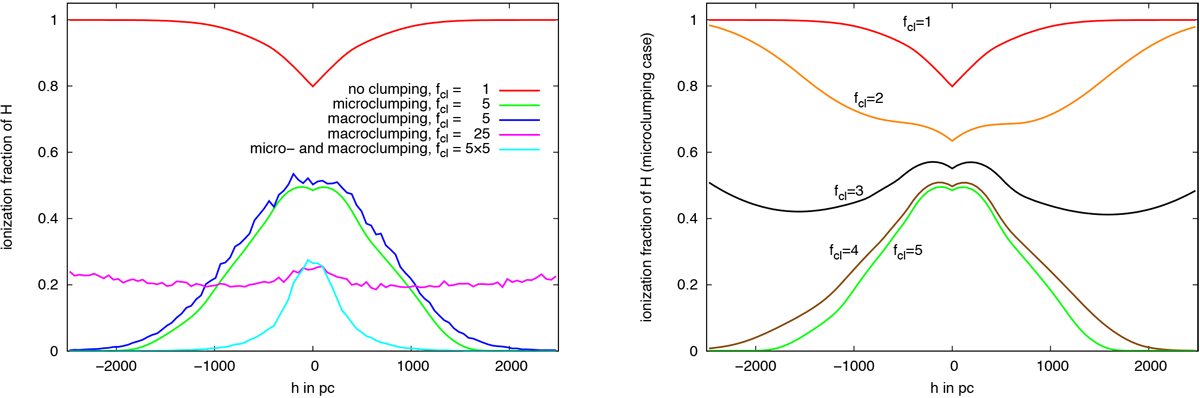
Left panel: ionization fractions of hydrogen as a function of the height above the galactic plane for the different clumping scenarios presented in Fig. 4. For the homogeneous density distribution, the gas is predominantly ionized throughout the simulation volume and the ionization fraction rises with increasing galactic heights due to the lower gas densities, which results in decreasing recombination rates and opacities. Both the micro- and the macroclumping case with fcl = 5 are characterized by a similar dependence on the height above the galactic plane, reaching approximately 0.5 near the galactic plane and dropping to 0.1 at a height of about 1.2 kpc. In contrast, in the macroclumping scenario with fcl = 25 the ionization fraction varies only slightly throughout the simulation volume. The combination of micro- and macroclumping shows the lowest ionization fraction of all the scenarios owing to the increased recombination rates in the filled cells. While the total clumping factor equals that of the fcl = 25 macroclumping case, there are fewer extended empty regions through which radiation can penetrate to greater distances from the galactic plane, where less ionizing radiation is required to maintain the same fraction ofionized hydrogen due to the lower gas densities. Right panel: as before, but for a parameter study varying the microclumping factor between 1 and 5. The ionization fraction rises at larger galactic heights inthe case of low clumping, whereas it decreases and the gas eventually becomes neutral for high clumping factors. For immediate clumping factors, which for our geometry and density are around fcl ~ 3, the ionization fraction as a function of height behaves in a nonmonotonic way, first dropping to a minimum and then rising again.
Current usage metrics show cumulative count of Article Views (full-text article views including HTML views, PDF and ePub downloads, according to the available data) and Abstracts Views on Vision4Press platform.
Data correspond to usage on the plateform after 2015. The current usage metrics is available 48-96 hours after online publication and is updated daily on week days.
Initial download of the metrics may take a while.