Fig. 4
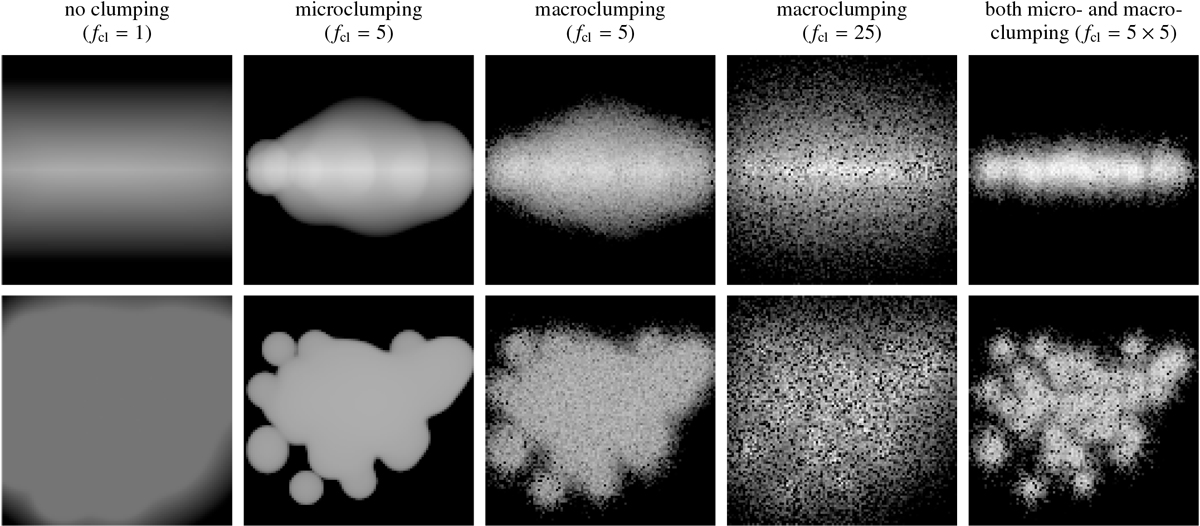
Edge-on and face-on emission measure maps for the different simulated clumping scenarios (see text). In each case we assumed a mean hydrogen number density of nH (h) = 0.1 cm−3 × e−|h|∕h0, where |h| is the distance from the galactic plane and h0 = 1 kpc is the scale height of the gas. The simulations also share the same distribution and luminosities of the ionizing sources. The edge lengths of the maps are 5 kpc. The macroclumping case with fcl = 5 appears generally very similar to the microclumping case with the same clumping factor, as is expected for sufficiently fine grid resolution. For fcl = 25, the macroclumping becomes very porous at the used grid resolution, opening up channels devoid of gas that allow radiation to escape from the immediate environment of the sources without being absorbed. The combined micro- and macroclumping case with fcl = 5 × 5 is very different from the macroclumping case with fcl = 25, giving an overall appearance resembling that of the cases with fcl = 5, but with theemission in each of the ionized bubbles more concentrated; this is somewhat analogous again to the transition from fcl = 1 to fcl = 5.
Current usage metrics show cumulative count of Article Views (full-text article views including HTML views, PDF and ePub downloads, according to the available data) and Abstracts Views on Vision4Press platform.
Data correspond to usage on the plateform after 2015. The current usage metrics is available 48-96 hours after online publication and is updated daily on week days.
Initial download of the metrics may take a while.