Fig. 3
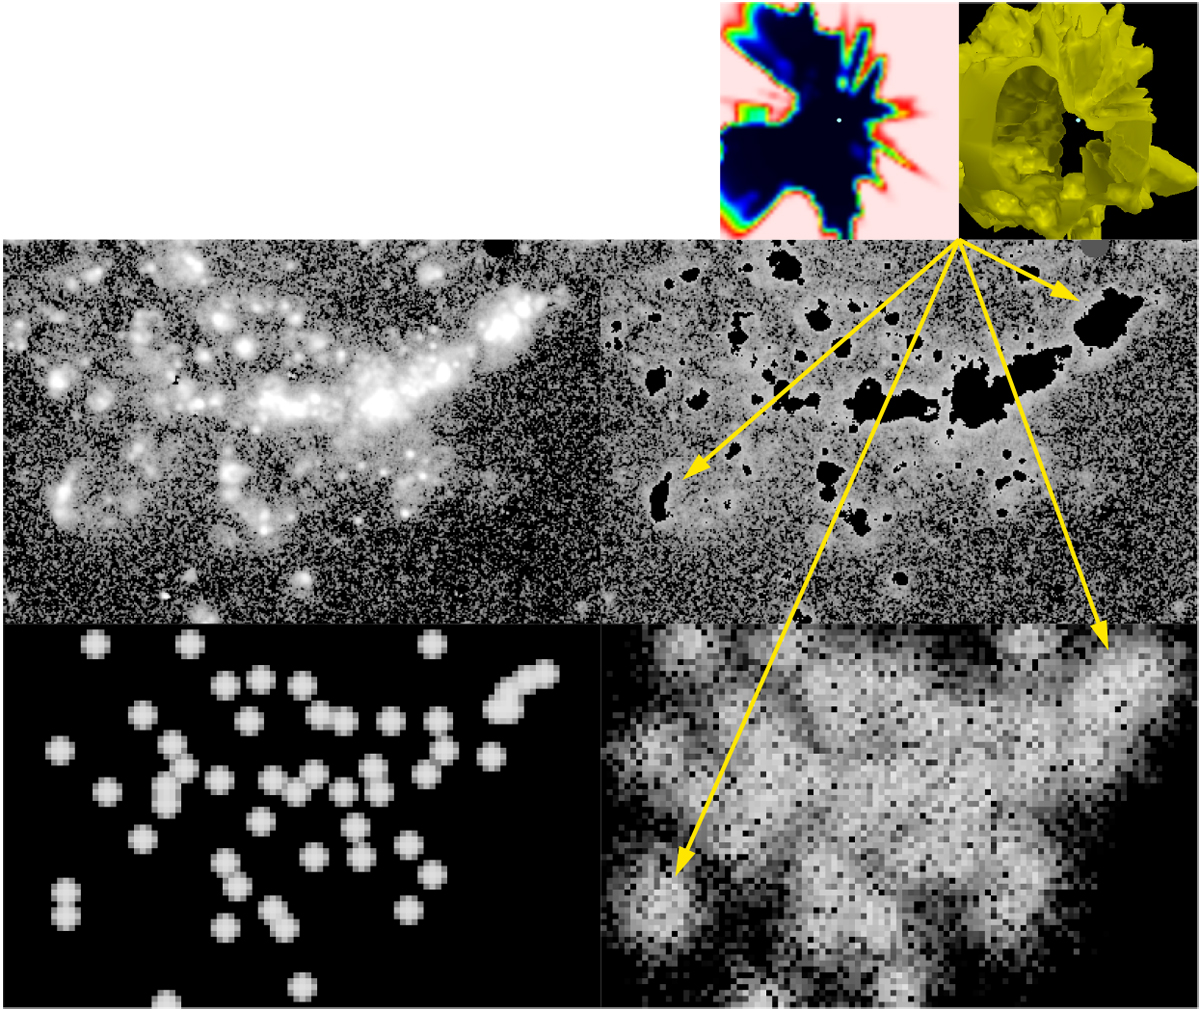
Comparison between Hα observations of H II regions and the DIG in the face-on galaxy M 81 by Greenawalt et al. (1998; middle row) and our simulation results (bottom row) of the ionization of the DIG by radiation escaping from the H II regions in the environment of the radiation sources. We find a reasonable qualitative agreement regarding both the denseand relatively intense H II regions around the star-forming regions on the left-hand side of the imageand the DIG on the right-hand side of the image. The simulation results presented in this image were computed for a combination of microclumping and macroclumping with a clumping factor of fcl = 5 each. The brightness values in these images as well as those in Fig. 4 represent an emission measure range between 1 and 750 pc cm-6 (logarithmicscaling). Observational images: ©AAS. Reproduced with permission.
Current usage metrics show cumulative count of Article Views (full-text article views including HTML views, PDF and ePub downloads, according to the available data) and Abstracts Views on Vision4Press platform.
Data correspond to usage on the plateform after 2015. The current usage metrics is available 48-96 hours after online publication and is updated daily on week days.
Initial download of the metrics may take a while.