Fig. A.1.
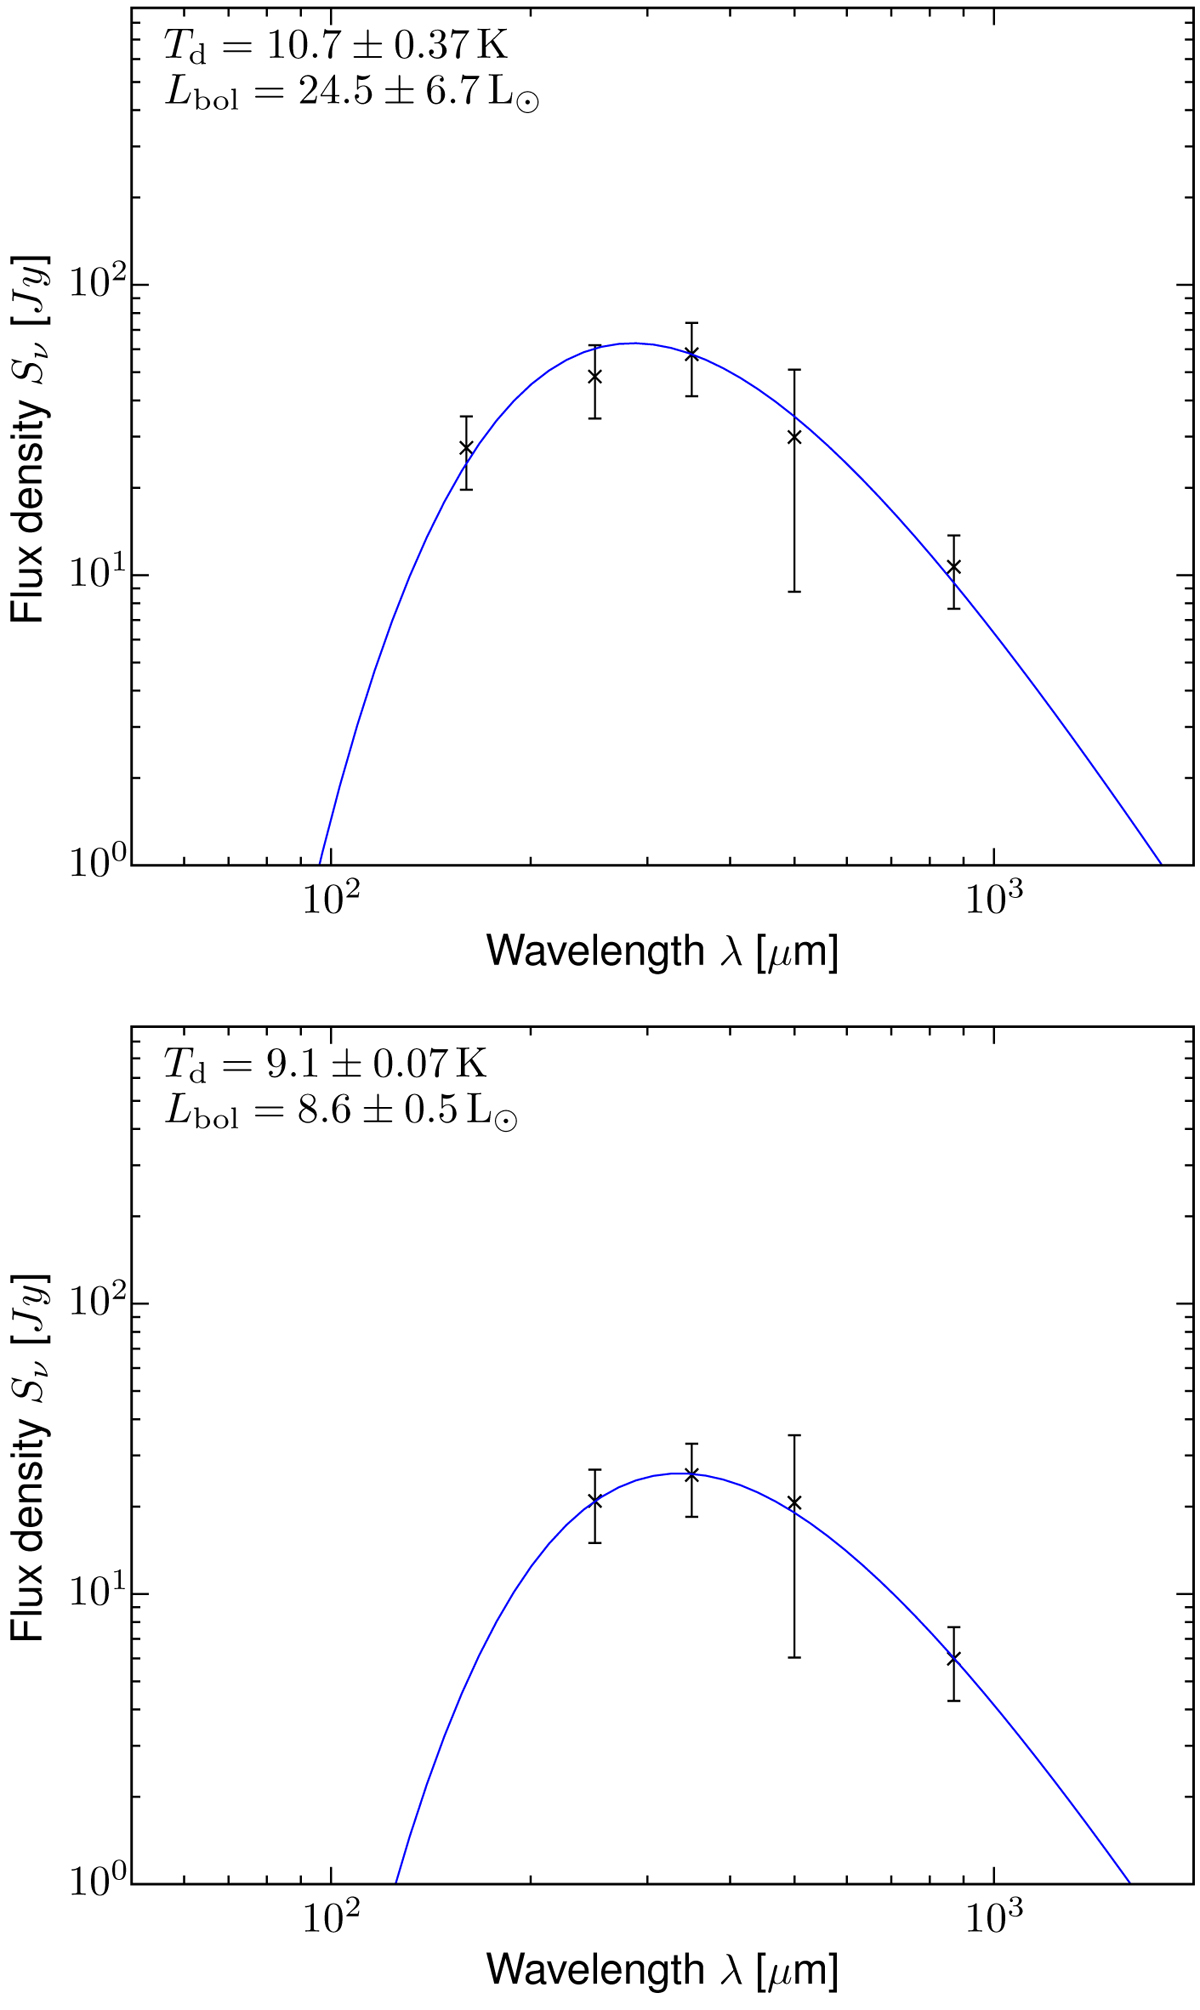
Spectral energy distribution based on Herschel (Molinari et al. 2016) and LABOCA data (Schuller et al. 2009) for G10.99−0.08 (top panel) and G28.33+0.07 (bottom panel). The data at different wavelengths are shown as squares with error bars. The temperature and bolometric luminosity obtained based on the SED fit assuming a dust opacity (β = 1.8) is also shown (König et al. 2017).
Current usage metrics show cumulative count of Article Views (full-text article views including HTML views, PDF and ePub downloads, according to the available data) and Abstracts Views on Vision4Press platform.
Data correspond to usage on the plateform after 2015. The current usage metrics is available 48-96 hours after online publication and is updated daily on week days.
Initial download of the metrics may take a while.