Fig. 8.
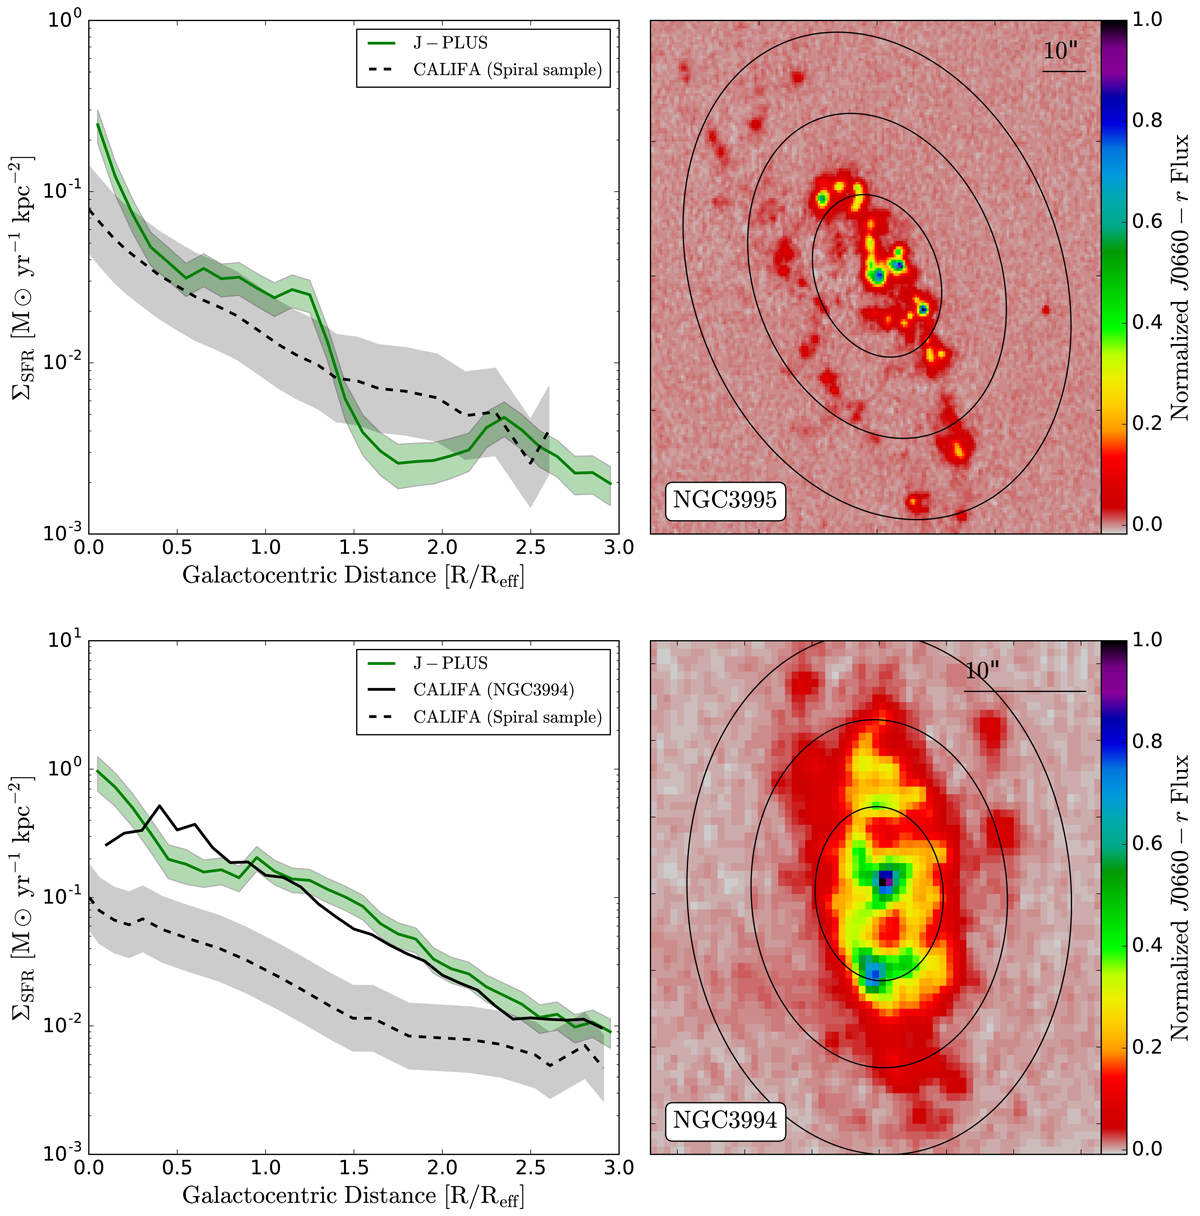
Star formation rate surface density (ΣSFR) with the shaded area representing the 1σ uncertainty of NGC 3995 (top left panel) and NGC 3994 (bottom left panel). 2D maps of the excess in the J0660 filter (right panels), representing the Hα emission areas are shown. One, two, and three R/Reff ellipses are overplotted. The ΣSFR values are compared in each case with a control sample of spirals matched in stellar mass and morphology (dashed black lines). Gray shaded areas show the dispersion of the ΣSFR in the spiral samples. The solid black line (bottom left panel) shows the CALIFA ΣSFR measurements of the galaxy. Both the spiral samples and the individual galaxy measurements were performed by González Delgado et al. (2016).
Current usage metrics show cumulative count of Article Views (full-text article views including HTML views, PDF and ePub downloads, according to the available data) and Abstracts Views on Vision4Press platform.
Data correspond to usage on the plateform after 2015. The current usage metrics is available 48-96 hours after online publication and is updated daily on week days.
Initial download of the metrics may take a while.