Fig. 7.
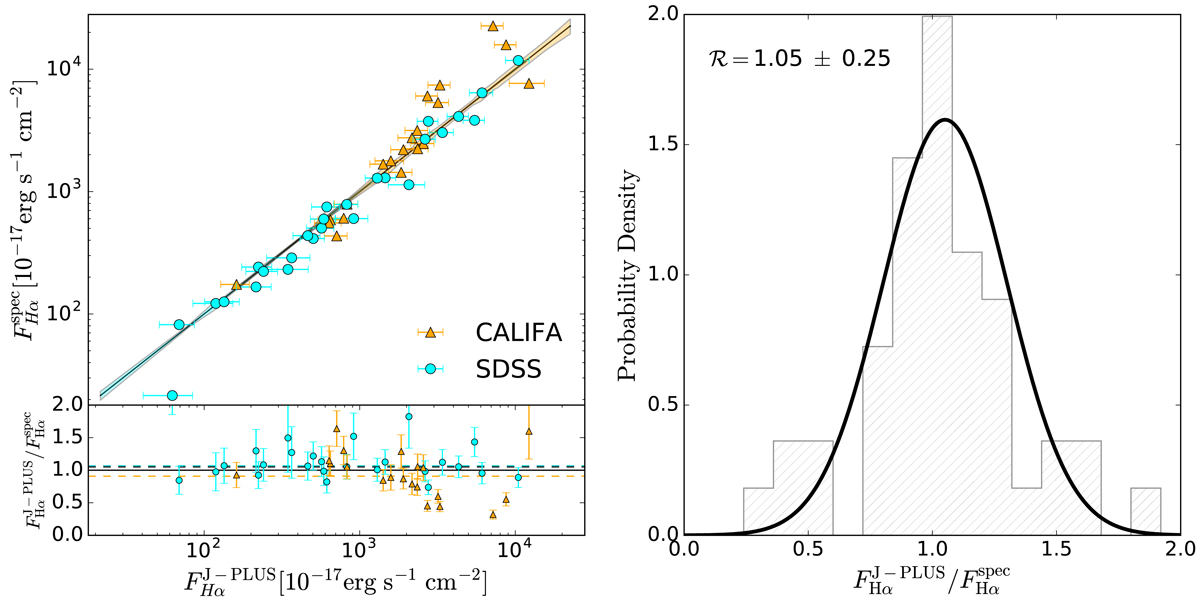
Left panel: comparison between J-PLUS and spectroscopic Hα emission line fluxes. The errorbars represent the J-PLUS uncertainties and the shaded areas the spectroscopic ones. The ratio between the fluxes is shown in the lower panel, with the median ratios of CALIFA, SDSS and the total sample represented in orange, blue and black dashed lines, respectively. Right panel: normalized distribution of the flux ratios with a Gaussian curve fitted. The median comparison ratio ℛ and its dispersion are displayed in the panel.
Current usage metrics show cumulative count of Article Views (full-text article views including HTML views, PDF and ePub downloads, according to the available data) and Abstracts Views on Vision4Press platform.
Data correspond to usage on the plateform after 2015. The current usage metrics is available 48-96 hours after online publication and is updated daily on week days.
Initial download of the metrics may take a while.