Free Access
Fig. 5.
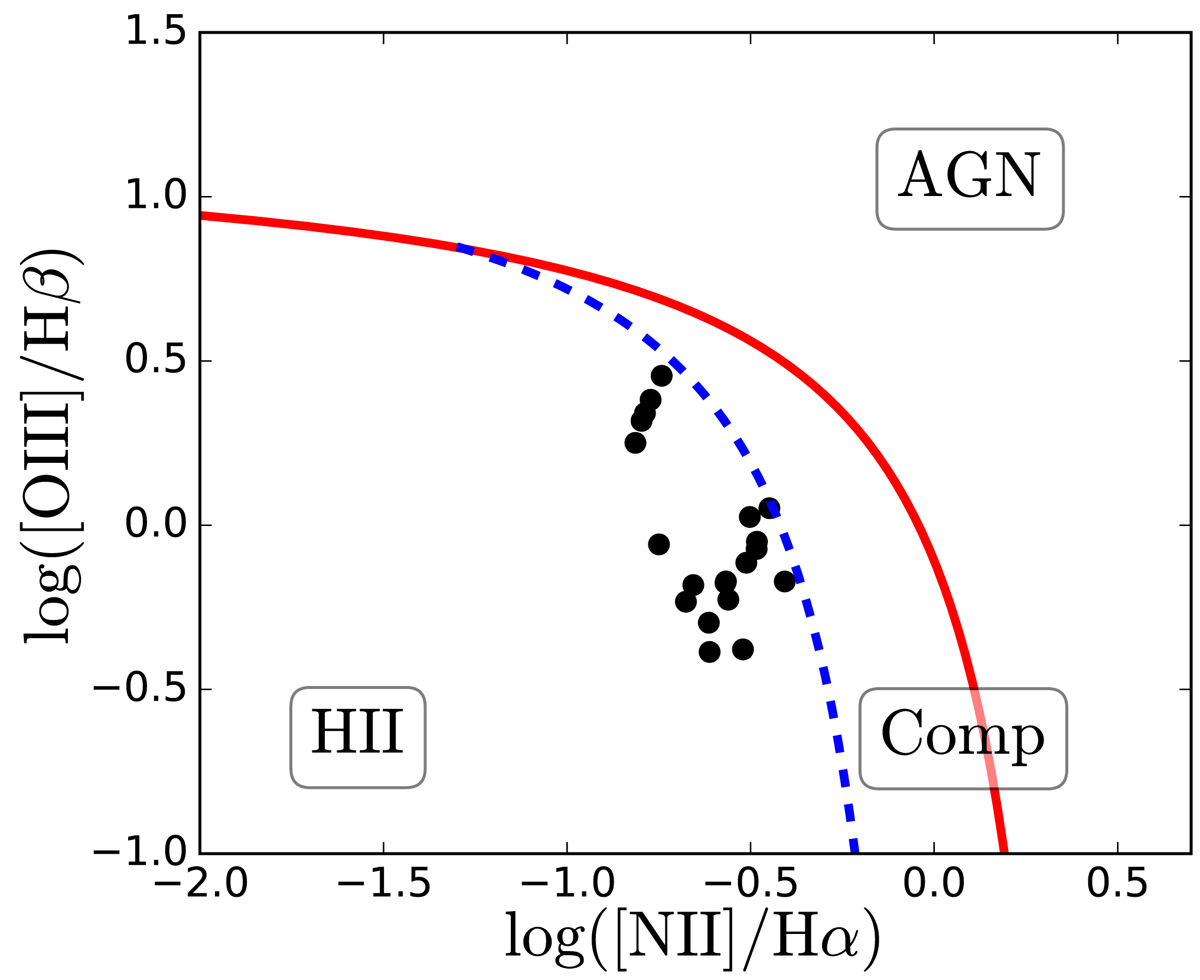
BPT diagram based on CALIFA data of the 20 selected star-forming regions in NGC 3991, NGC 3994 and NGC 4470. The blue-dashed and red lines delimit the composite and AGN zone, respectively (Kewley et al. 2001; Kauffmann et al. 2003).
Current usage metrics show cumulative count of Article Views (full-text article views including HTML views, PDF and ePub downloads, according to the available data) and Abstracts Views on Vision4Press platform.
Data correspond to usage on the plateform after 2015. The current usage metrics is available 48-96 hours after online publication and is updated daily on week days.
Initial download of the metrics may take a while.