Free Access
Fig. 4.
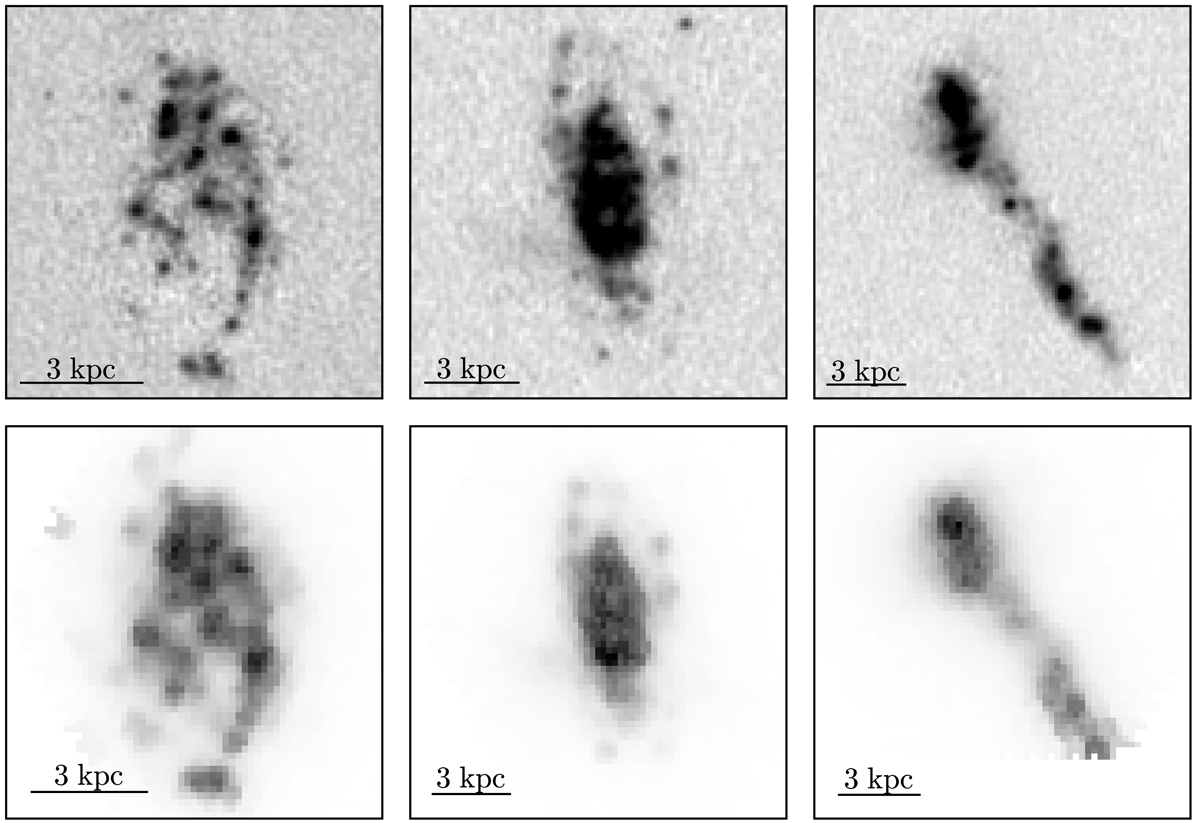
J-PLUS images showing Hα emission areas with the flux excess in the J0660 band, J0660 − r (top panels), and CALIFA Hα maps (bottom panels) of the selected star-forming galaxies: NGC 4470 (left panels), NGC3994 (centre panels), and NGC 3991 (right panels). For reference, north is up and east is left.
Current usage metrics show cumulative count of Article Views (full-text article views including HTML views, PDF and ePub downloads, according to the available data) and Abstracts Views on Vision4Press platform.
Data correspond to usage on the plateform after 2015. The current usage metrics is available 48-96 hours after online publication and is updated daily on week days.
Initial download of the metrics may take a while.